** NEW BLOG: Read posts on Matthew from experts in the Southeast Region **
Hurricane Matthew, a category 3 hurricane at 8 AM ET October 7, moved up the southeast coast, eventually making landfall as a category 1 hurricane just north of Charleston, SC on Oct. 8. Maximum sustained winds were near 120 mph during the US portion of its track. NOAA National Hurricane Center (NOAA NHC) accurately forecasted its track up the southeastern coast. The US IOOS Regional Associations – CariCOOS, MARACOOS, and SECOORA – captured the storm in real time.
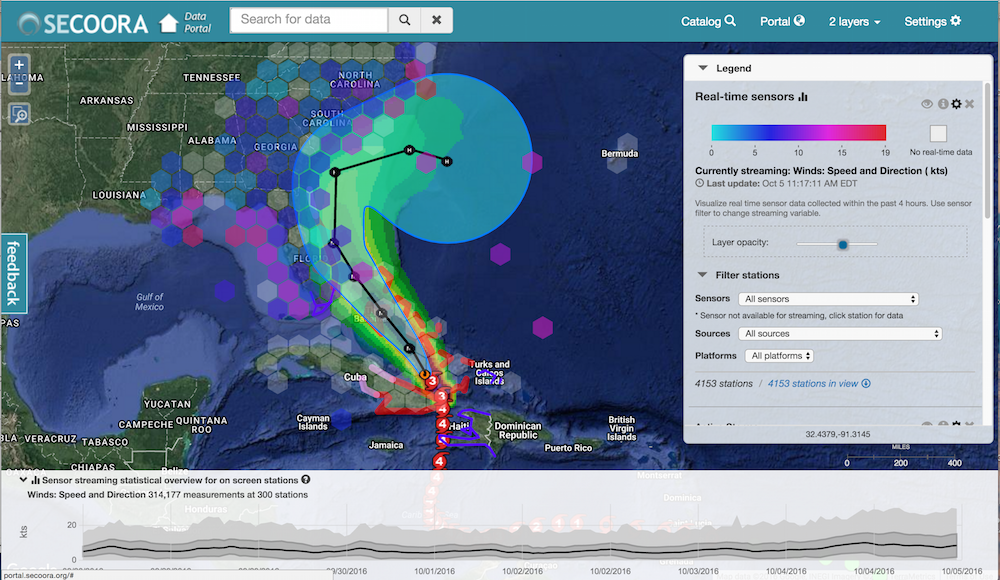
Pictured is NOAA’s National Hurricane Centers predicted track for Matthew displayed on the SECOORA Data Portal. Each hexagon represents the number of real time data sensors in the area. Use the SECOORA Data portal to explore, download and visualize ocean and coastal data in Matthew’s Path.
SECOORA Observing and Modeling Assets Relevant to Matthew
Buoys
Matthew is predicted to traverse through the South Atlantic Bight. SECOORA and US IOOS support marine weather buoys off of the coast of North Carolina and South Carolina.
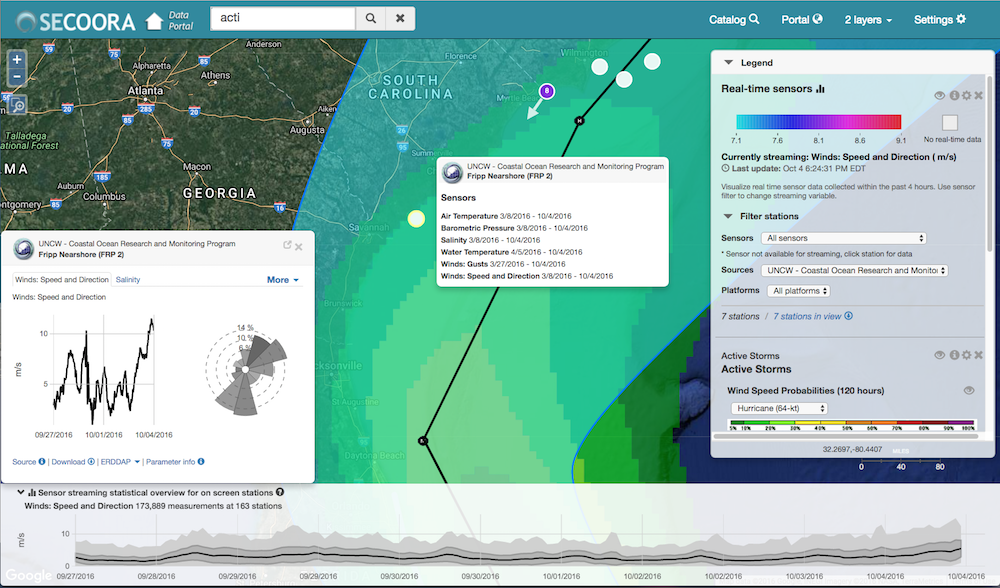
Pictured is data from the Fripp Nearshore 2 Buoy. University of North Carolina Wilmington Coastal Ocean Research and Monitoring Program operates the buoys. Contact Lynn Leonard, UNCW, for more information. In case Matthew’s moves west, view the SECOORA and US IOOS funded marine weather buoys, C10, C12 and C13, in the Gulf of Mexico.
High Frequency Radar
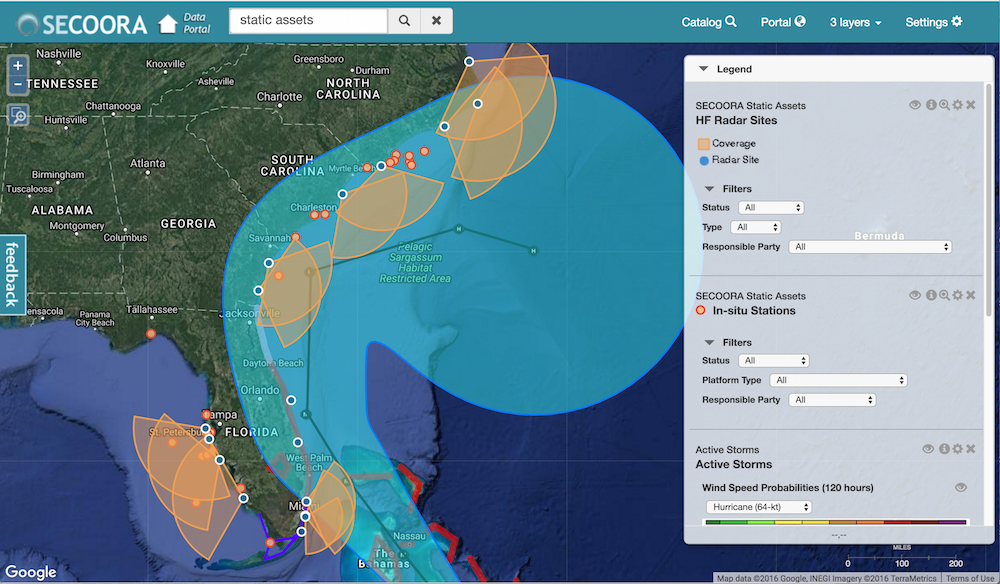
High Frequency (HFR) use radar technology to map surface currents in real-time. SECOORA and US IOOS support many HFR systems along the South Atlantic Bight. Pictured below is Matthew’s predicted track over our assets.
3 WERA High Frequency radars in south Florida (Crandon Park on Key Biscayne, Virginia Key and John U Lloyd Park on Dania Beach) operated byNick Shay, University of Miami Rosenstiel School of Marine and Atmospheric Sciences, for more information. Click here for data.
3 CODAR radar installations on the Outer Banks of North Carolina. The radars are located at Duck, Cape Hatteras and Core Banks. The radars are operated by Harvey Seim, University of North Carolina at Chapel Hill. Click here for data.
2 WERA radar installations are along the Georgia coasts. The radars are located at St. Catherine’s Island (since 2006) and Jekyll Island (since 2010). The radars are operated by Dana Savidge, University of Georgia, Skidaway Institute of Oceanography. Note: An alternate sampling strategy is being used for the the two radar systems to make measurements under hurricane Matthew. Systems may appear offline. Click here for data.
2 WERA radar installations are monitoring Long Bay, SC. The radars are located at Fort Caswell, NC and Georgetown, SC.). The radars are operated George Voulgaris, University of South Carolina. Click here for data.
3 CODAR radar and 2 WERA radar installations are monitoring the West Florida Shelf. The CODAR systems are located at Redington Shores, Venice and Naples. The WERA systems are located at Fort DeSoto and Venice. The radars are operated by Robert Weisberg, University of South Florida. Click here for data
Data Portal
Getting a multilayer integrated overlay of data during a storms passing is important.
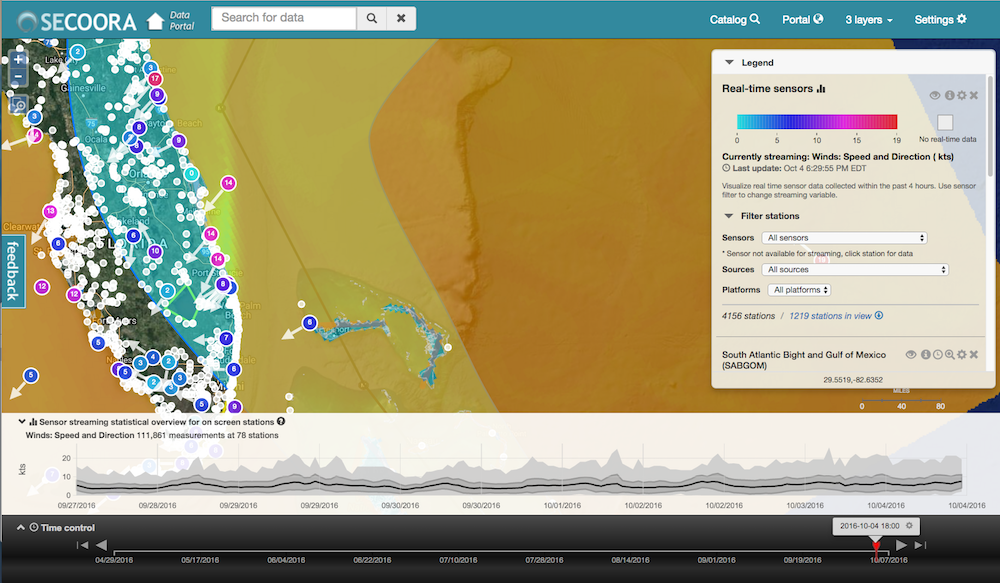
When a storm is approaching, use the SECOORA Data Portal sensors map to see the storm data in real time or overlay the SABGOM Model Potential Temperature layer to see the water temperature Matthew will encounter (pictured above). Click here to access SABGOM Model data produced by Ruoying He, North Carolina State University.
Other Resources
SECOORA Data Portal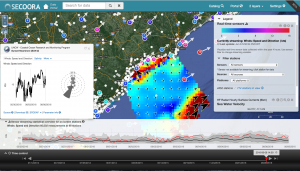 |
The SECOORA Data portal is a tool to explore, download and visualize ocean and coastal data in the SECOORA domain. When a storm is approaching, check out the sensors map to see the storm data in real time. |
SECOORA Marine Weather Portal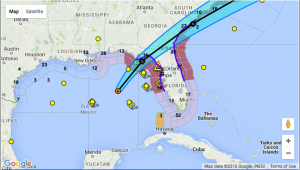 |
The Marine Weather Portal (MWP) provides marine observations, forecasts and short and long-fuse warnings for the coastal waters of North Carolina, South Carolina and northern Georgia and the Atlantic and Gulf Coast areas of the Southern Region. Click here to access the MWP.
Note: We are in the process of upgrading the MWP and Please use caution while using the same as some data layers may not be available. |
University of South Florida’s Coastal Ocean Monitoring and Prediction System (USF COMPS)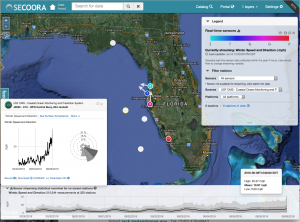 |
USF COMPS consists of an array of instrumentations along the West Florida Shelf. The data collected supports the a variety of management issues, including more accurate predictions of coastal flooding by storm surge, safety and efficiency of marine navigation, search and rescue efforts, and fisheries management. . Buoy data from C12 in the Gulf of Mexico is pictured on the right. Access data here. |
University of North Carolina Wilmington Coastal Ocean Research and Monitoring Program (UNCW CORMP)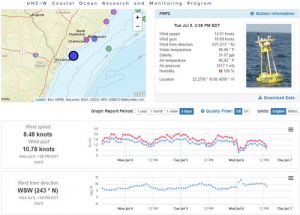 |
The University of North Carolina Wilmington’s Coastal Ocean Research and Monitoring Program (CORMP), established in 2000, operates nine mooring stations in North Carolina and South Carolina. Access data here. |
Long Bay Observing System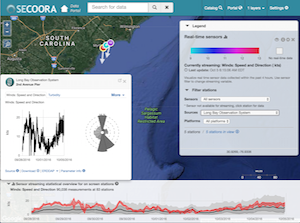 |
The Coastal Carolina University operators near real time instruments along the coast of South Carolina. Click here to access the data. |
Indian River Lagoon LOBO Systems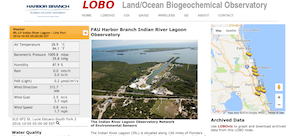 |
The Florida Atlantic University Harbor Branch operates Land/Ocean Biogeochemical Observatory (LOBO) units in the Indian River Lagoon and St. Lucie Estuary on the east coast of Florida. Click here to access data. |
USGS Coastal Hazards Portal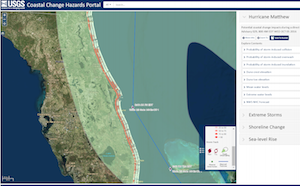 |
U.S. Geological Survey’s (USGS) Coastal Change Hazards Portal is an interactive portal that allows you access to forecasts on the probability of dune erosion, overwash, and inundation/flooding. The portal is updated regularly as new NOAA surge forecasts are issued and include the impacts of waves and wave runup. Click here to access data. |
SABGOM Model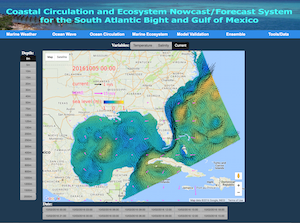 |
The South Atlantic Bight and Gulf of Mexico (SABGOM) is an integrated ocean circulation, wave, atmosphere, and marine ecosystem prediction system for the South Atlantic Bight and the Gulf of Mexico. The SABGOM prediction system is a 3-dimensional, high-resolution regional nowcast/forecast system incorporating the ROMS model for circulation, the WRF model for atmospheric circulation, the SWAN model for surface waves. Click here for data. |
CNAPS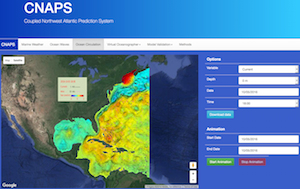 |
The Coupled Northwest Atlantic Prediction System (CNAPS) si a three-dimensional marine environment nowcast and forecast model developed by the Ocean Observing and Modeling Group at North Carolina State University. It covers the entire footprint of Matthew. This fully coupled ocean circulation, wave, and atmosphere model predicts conditions over a wide area of the coastal northwest Atlantic Ocean based on data collected daily. Click here for Data. |
Storm Surge Modeling System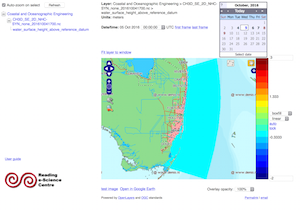 |
The Advanced Coastal Modeling System (ACMS) which is a 2D/3D realtime forecasting system for coastal surge, wave, and salinity developed by the University of Florida team of Drs. Peter Sheng, Vladimir Paramygin, and Justin Davis. Click here to access data. |
Altimeter-Derived Atlantic Oceanic Heat Content (OHC) Variability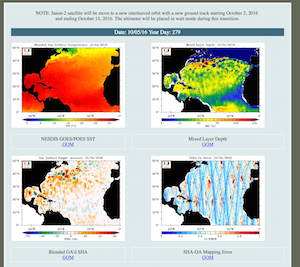 |
Operated by Nick Shay, University of Miami Rosenstiel School of Marine and Atmospheric Science, the satellite-derived ocean heat content represents the integrated heat from the surface to the depth. Click here to access data. |
WERA Surface Currents/Waves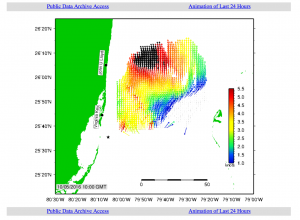 |
The University of Miami/Rosenstiel School of Marine and Atmospheric Sciences is currently operating three WERA High Frequency radars in Crandon Park on Key Biscayne, Virginia Key and John U Lloyd Park on Dania Beach. The radars at Crandon Park transmit at 16MHz, Virginia Key and Dania Beach transmit at 12MHz and provide measurement of currents on the ocean’s surface over a large area of the ocean off Miami, FL. The most recent hourly average surface current data is plotted on a 2.4 km grid here. |
Surfline Camera Network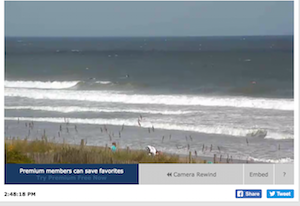 |
The Surfline camera network gives a real time look into the ocean conditions. They have cameras located all across the US. With many cameras in the SECOORA domain, choose a location and view the waves. |
NOAA National Hurricane Center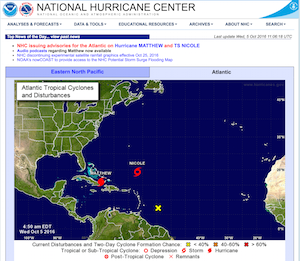 |
The National Hurricane Center (NHC) is a component of the National Centers for Environmental Prediction (NCEP). The NHC is the trusted source for best watches, warnings, forecasts, and analyses of hazardous tropical weather. Visit their website for most up to date information. |
Weatherflow StormTrack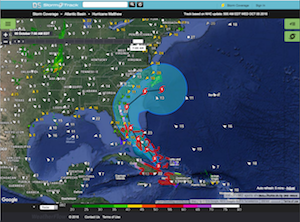 |
StormTrack allows you to see the latest predicted track of an identified storm. By using their wealth of real time observations, meteorological tools, and precision models, you can see exactly how each storm is progressing. Each storm page grants access to premium level data for the duration of the storm. Click here to access the StormTrack. |
Coastal Emergency Risks Assessment (CERA)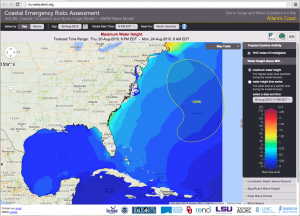 |
CERA is a component of the Advanced Surge Guidance System (ASGS). Based on the Advanced Circulation and Storm Surge model (ADCIRC), coupled with the SWAN Wave model, the ASGS generates real-time storm surge guidance for updating emergency response groups during a tropical or hurricane event. The CERA web application provides an easy-to-use interactive web interface which allows emergency managers to quickly evaluate critical situations. Information and maps related to the official hurricane advisories as issued by the National Hurricane Center are available every six hours during a storm. Click here to access CERA. |
Jyotika’s Storm Blog |
A fun and educational blog concerning tropical storms and witty weather forecasting. From baby blobs to hectic hurricanes, from sci-fi to classic literature, this blog combines science and humor to inform and entertain. Click here to access the blog. |
MARACOOS Blog |
The IOOS region in the Mid-Atlantic, MARACOOS, operates a blog that analyzes the storm. Explore the blog for more information: http://maracoos.org/blogs/main/ |
CariCOOS Hurricane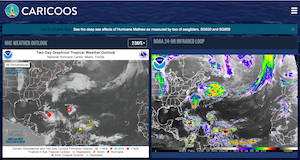 |
The IOOS region in the Caribbean, CariCOOS, has a Hurricane Season page the produces the most up to date information on hurricanes in the Atlantic. http://www.caricoos.org/hurricane-season |
Florida Institute of Technology |
ADCIRC Surge Guidance System (ASGS): Robert Weaver, FIT is running the Florida Indian River Lagoon (IRL) forecasting model for Hurricane Matthew based most recent data from the NHC advisory. The model is run twice a day using the most recent data from NHC advisory. Click here for NHC advisory 33 IRL surge forecast run results.
The 33 NHC advisory forecast run has increased potential for storm surge in the southern ML in the IRL, the scale for the legend reflects the increase in flooding potential.The barrier island in S mosquito lagoon overtops, this is consistent with earlier predictions. Wabasso also consistently is forecast to have 3-4 m of surge. Note: Results will be available as long as the resources are available and computer keeps running and producing. |
NOAA’s nowCOAST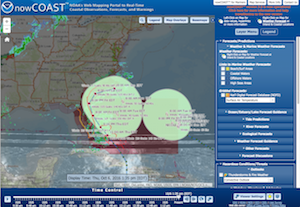 |
NOAA’s nowCOAST displays present and future environmental conditions for coastal and marine users by integrating data and information from across NOAA, other federal agencies, and regional ocean and weather observing systems. This GIS-based online web mapping service provides frequently updated weather and ocean observations, coastal and marine weather warnings and forecasts, and National Hurricane Center potential storm surge flooding map. Click here for data. |
Storm QuickLook for Hurricane Matthew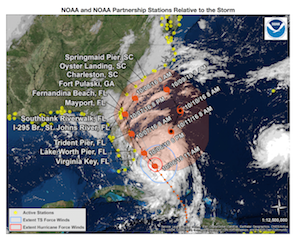 |
When NOAA issues a tropical storm warning for the U.S. or its territories, the Storm QuickLook is activated. This online tool is a snapshot of near real-time coastal and weather observations for areas affected by a storm. A map shows the location of tide gauges in reference to storm information, followed by an overview of current conditions and links to the latest NWS advisories. Data available includes time-series plots of water level and meteorological data at selected locations are updated in near real-time every 6 minutes. Following significant storms, CO-OPS will also issue post-storm data reports displaying verified water level measurements during the storm and highlighting maximum storm tide and storm surge at locations affected by the storm. Click here for data. |
USGS Flood Event Viewer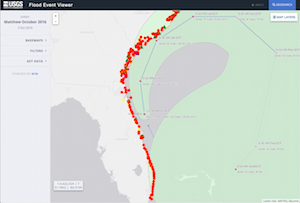 |
The USGS Flood Event Viewer (FEV) is the public data discovery component of the Short-Term Network (STN) database. It features 200+ USGS storm surge sensors and rapid deployment real-time gauges. Access Data > |
Weather-Ready Nation Ambassador™
As a Weather-Ready Nation Ambassador™, SECOORA is committed to working with NOAA and other Ambassadors to strengthen national resilience against extreme weather. Click here to read more about WRN.Explore SECOORA partners and member organization hurricane support resources by clicking here.
Email abbey@secooraorgpact.wpengine.com if you have any questions.
Related news
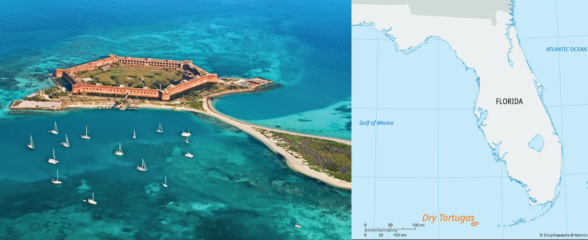
New High Frequency Radar at the Dry Tortugas National Park Improves Ocean Surface Current Measurements Across the Straits of Florida
A new CODAR Low-Power SeaSonde HFR has been deployed by the University of South Florida at Fort Jefferson on Garden Key to measure surface currents to improve understanding and prediction of the Gulf of Mexico Loop Current.
President Biden Proposes Significant Budget Cuts to IOOS for 2025
President Biden’s recent 2025 budget proposal slashed the funding allocated for the Integrated Ocean Observing System (IOOS) by 76%, which would effectively shut down coastal and ocean observing efforts.
Webinar: NOAA Resources to Help Coastal Communities Understand Flood Risk
Join us Wednesday, March 27th at 12 PM Eastern Time for SECOORA's Coastal Observing in Your Community Webinar Series to hear from Doug Marcy with the NOAA Office for Coastal Management.