Last updated October 17, 2022
Hurricane Ian made a devastating landfall in Southwest Florida on September 28 as a Category 4 storm with over 150 mph sustained wind speeds.
After crossing Florida, Hurricane Ian re-intensified to a Category 1 storm along the South Atlantic Bight and made a second US landfall in South Carolina with sustained winds of 85mph on September 30.
SECOORA’s observing network of technology and people collected data throughout the powerful storm.
Below are highlights of data collected.
Tracking the Storm Offshore with Buoys
An array of SECOORA funded buoys maintained off the West coast of Florida and the Carolinas were in the direct path of Ian. The buoys collected impressive data and many withstood the powerful force of Hurricane Ian.
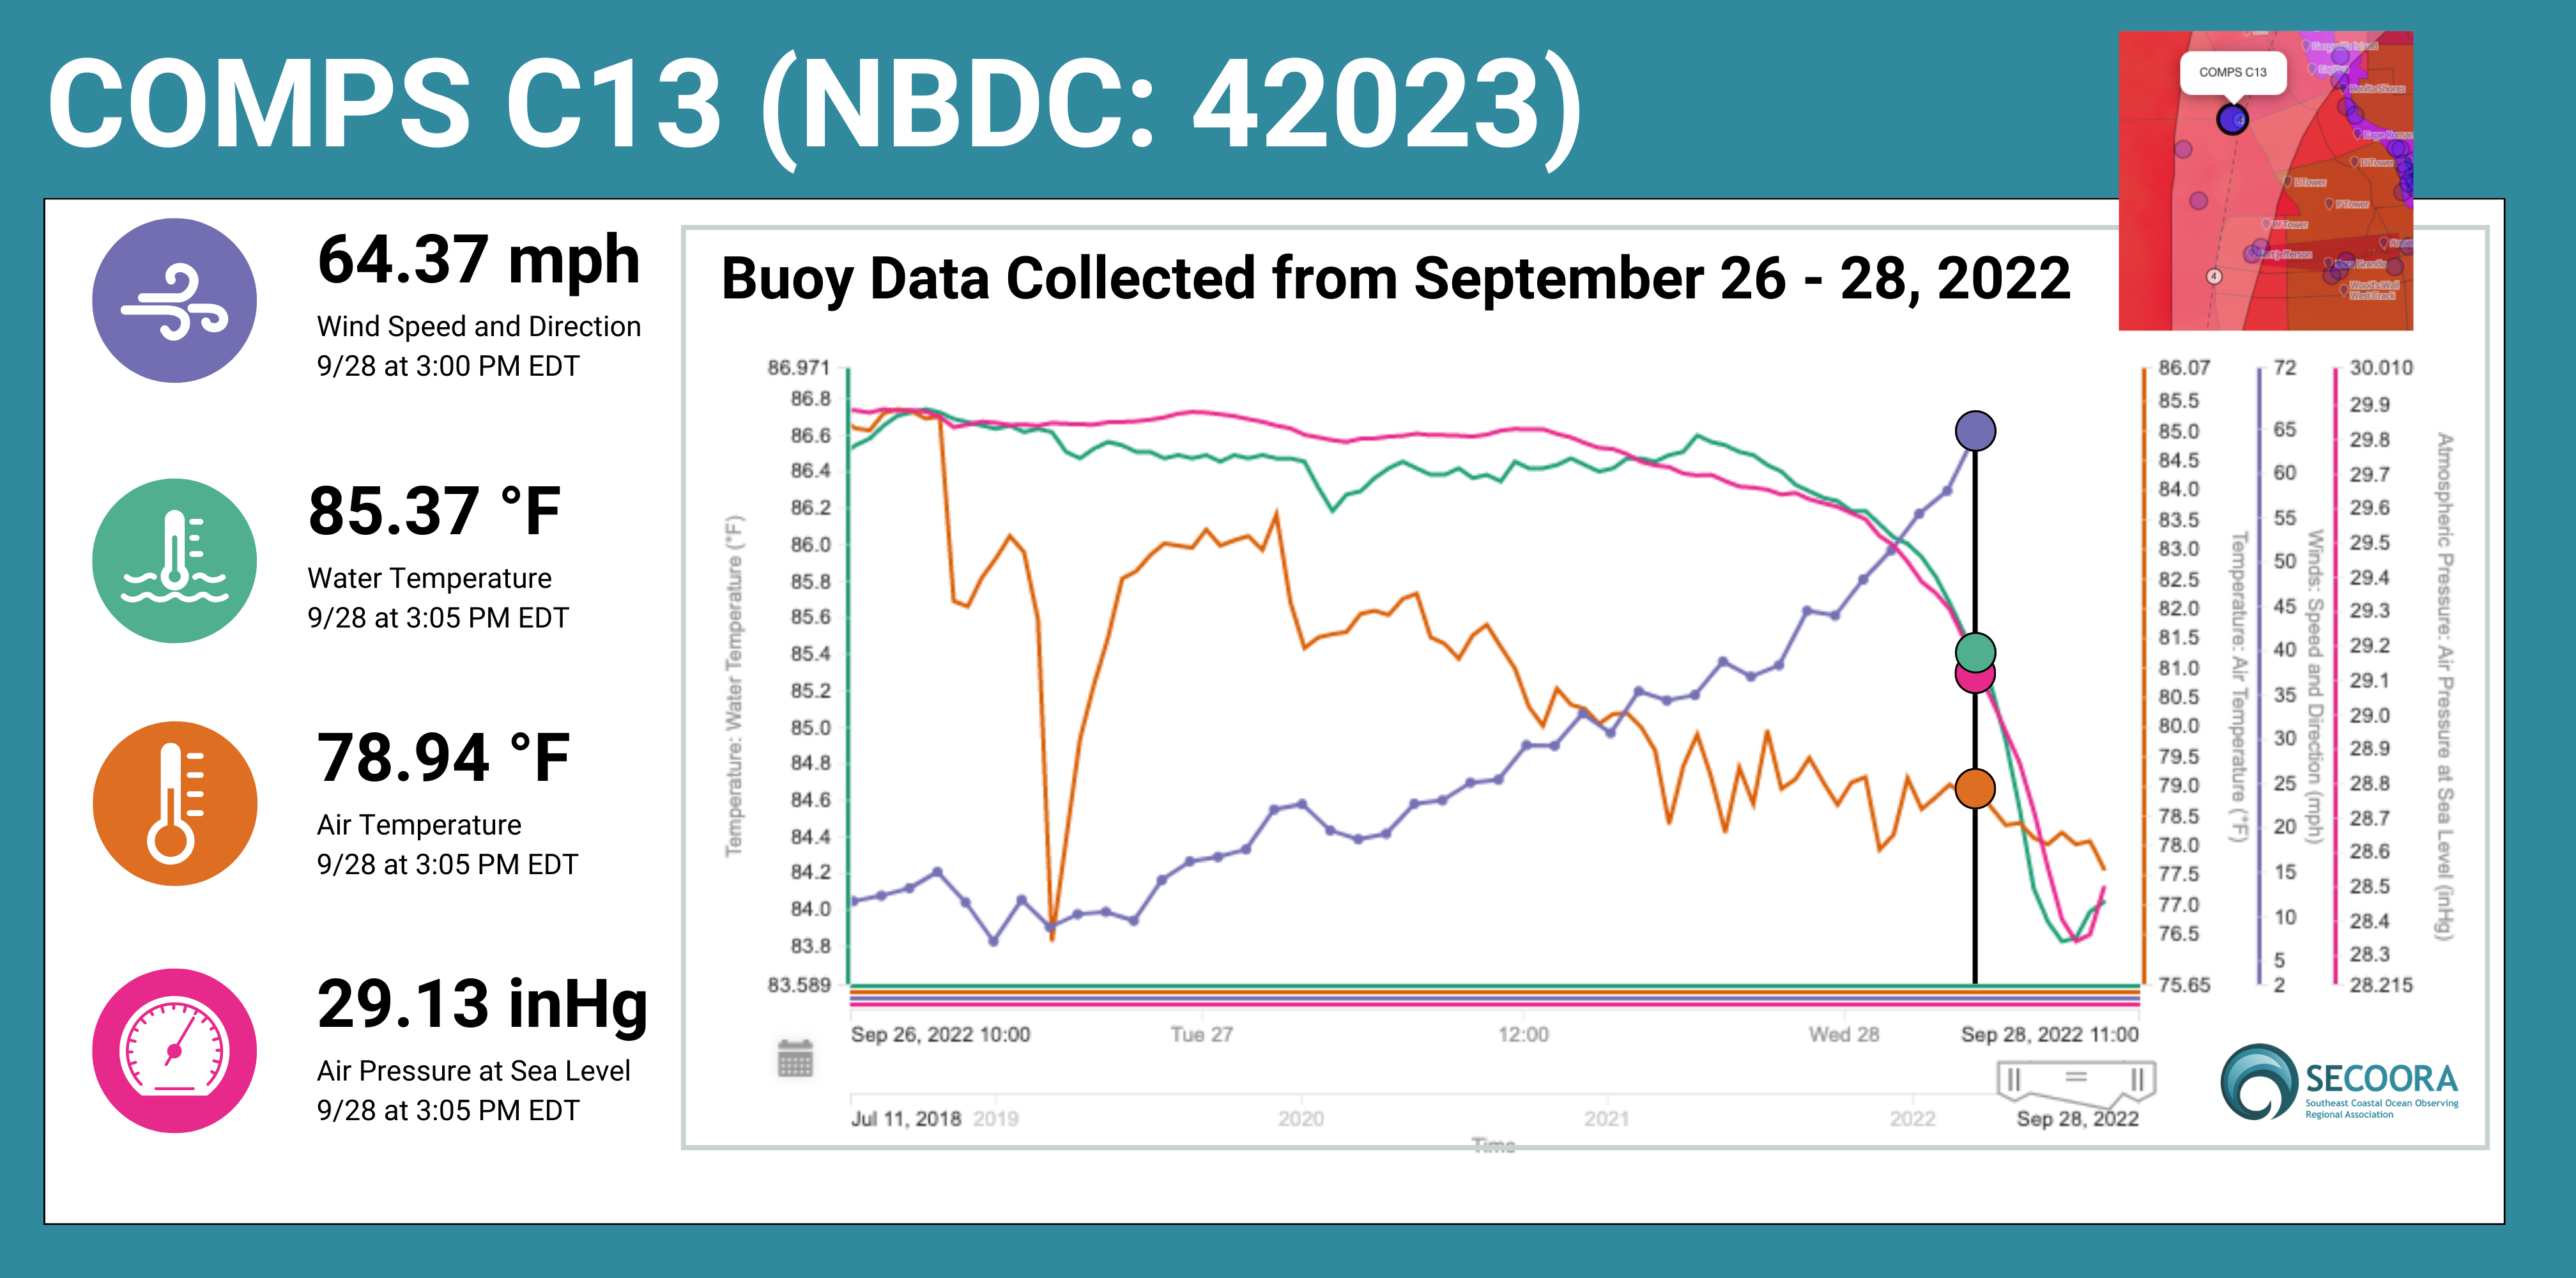
Buoys off the west coast of Florida maintained by University of South Florida (USF) reported hourly during the storm.
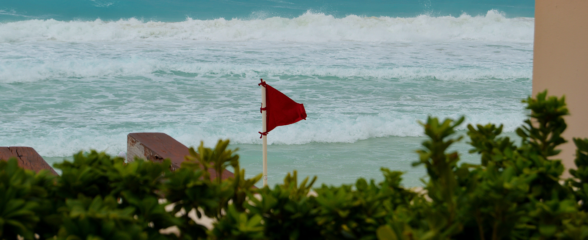
Buoy C22, anchored in 70m of water, was moved 1 mile from its deployment during the passage of Ian. Buoy C13 reported a 64 mph wind speed (pictured above) before data stopped flowing. Buoy C13 was moved almost 10 miles from its deployment location during the storm. The CDIP buoy 226 (Pulley Ridge) measured wave heights of 52 ft (15.92 m) during the storm (see image below).
The high waves are attributed with moving the COMPS buoys from their original mooring locations. The COMPS team is working on a plan to assess damage and get the buoys back to their deployment sites.
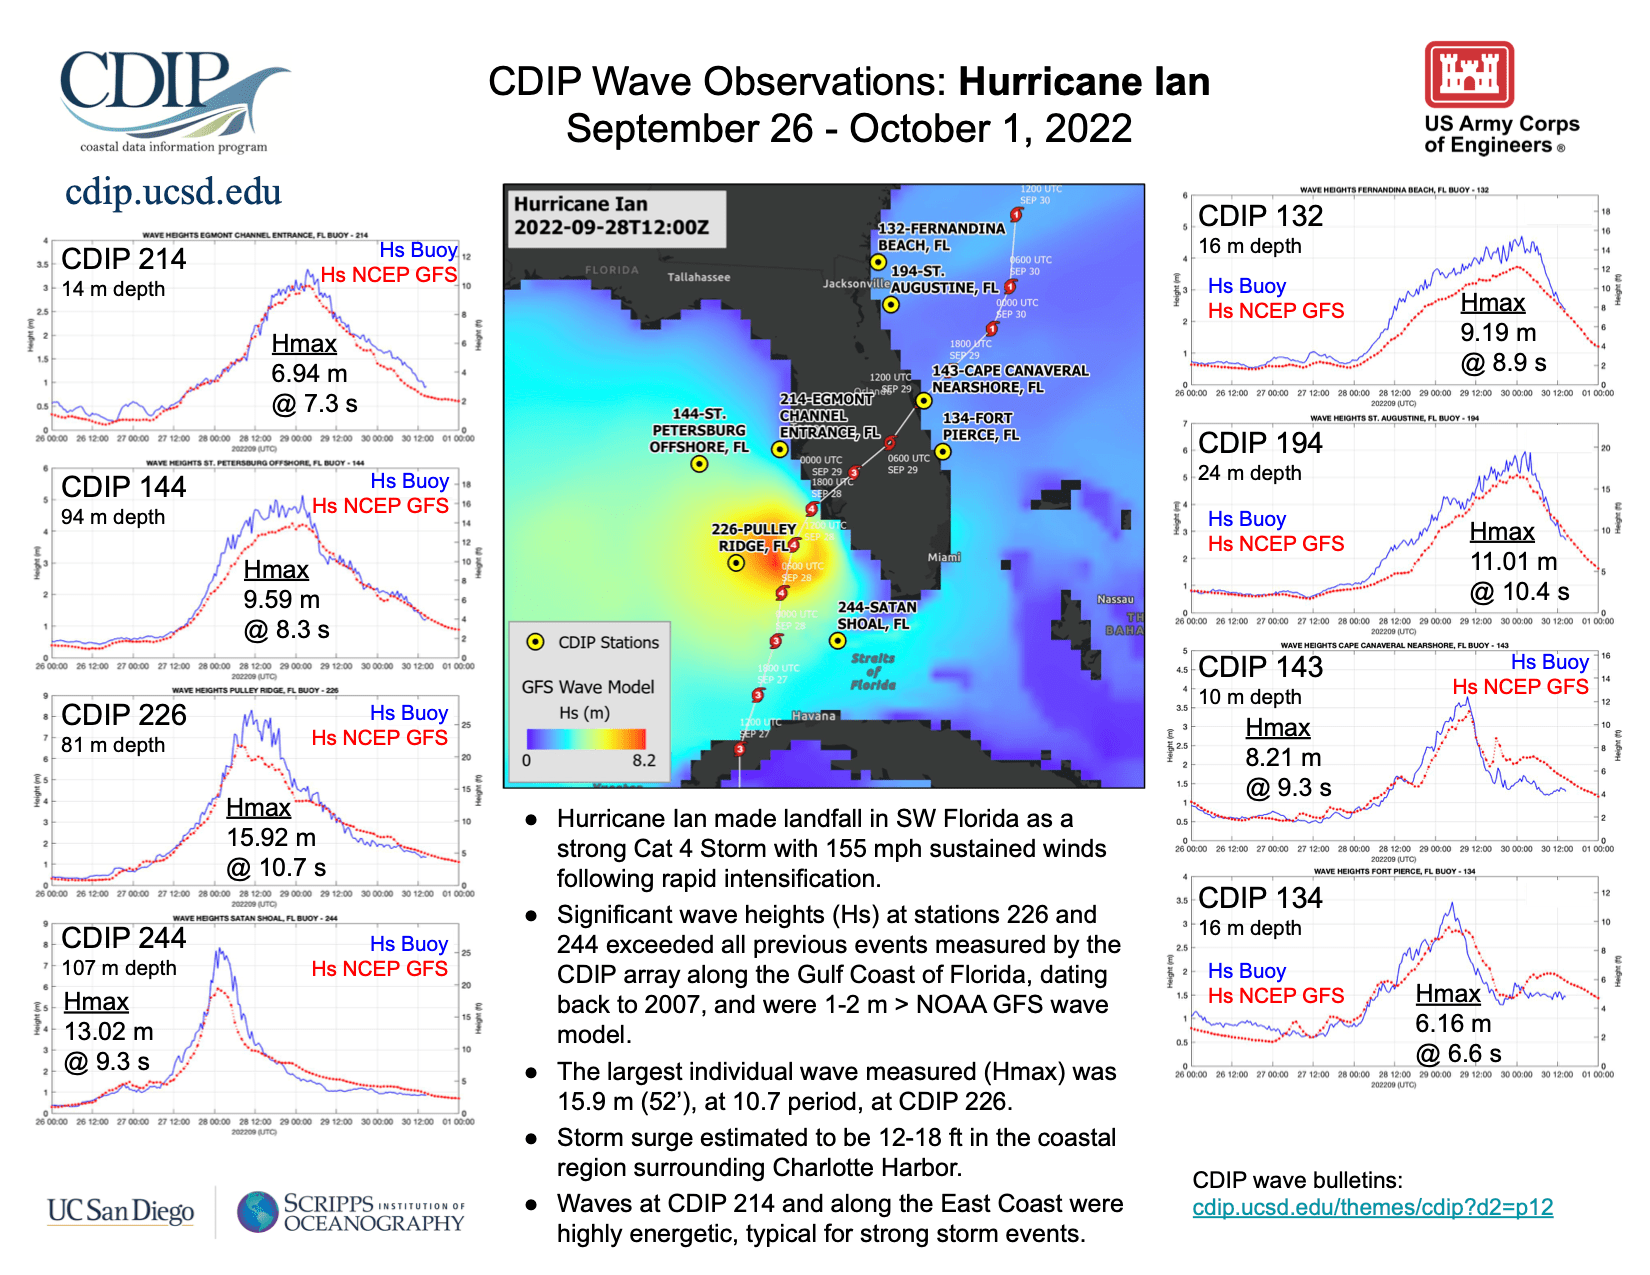
A network of wave buoys maintained by CDIP also captured important wave data height. Hurricane Ian brought the largest waves yet measured by the CDIP array off West Florida. Here’s a summary of the waves measured. CDIP 226 Pulley Ridge captured a wave height of 15.92 meters.
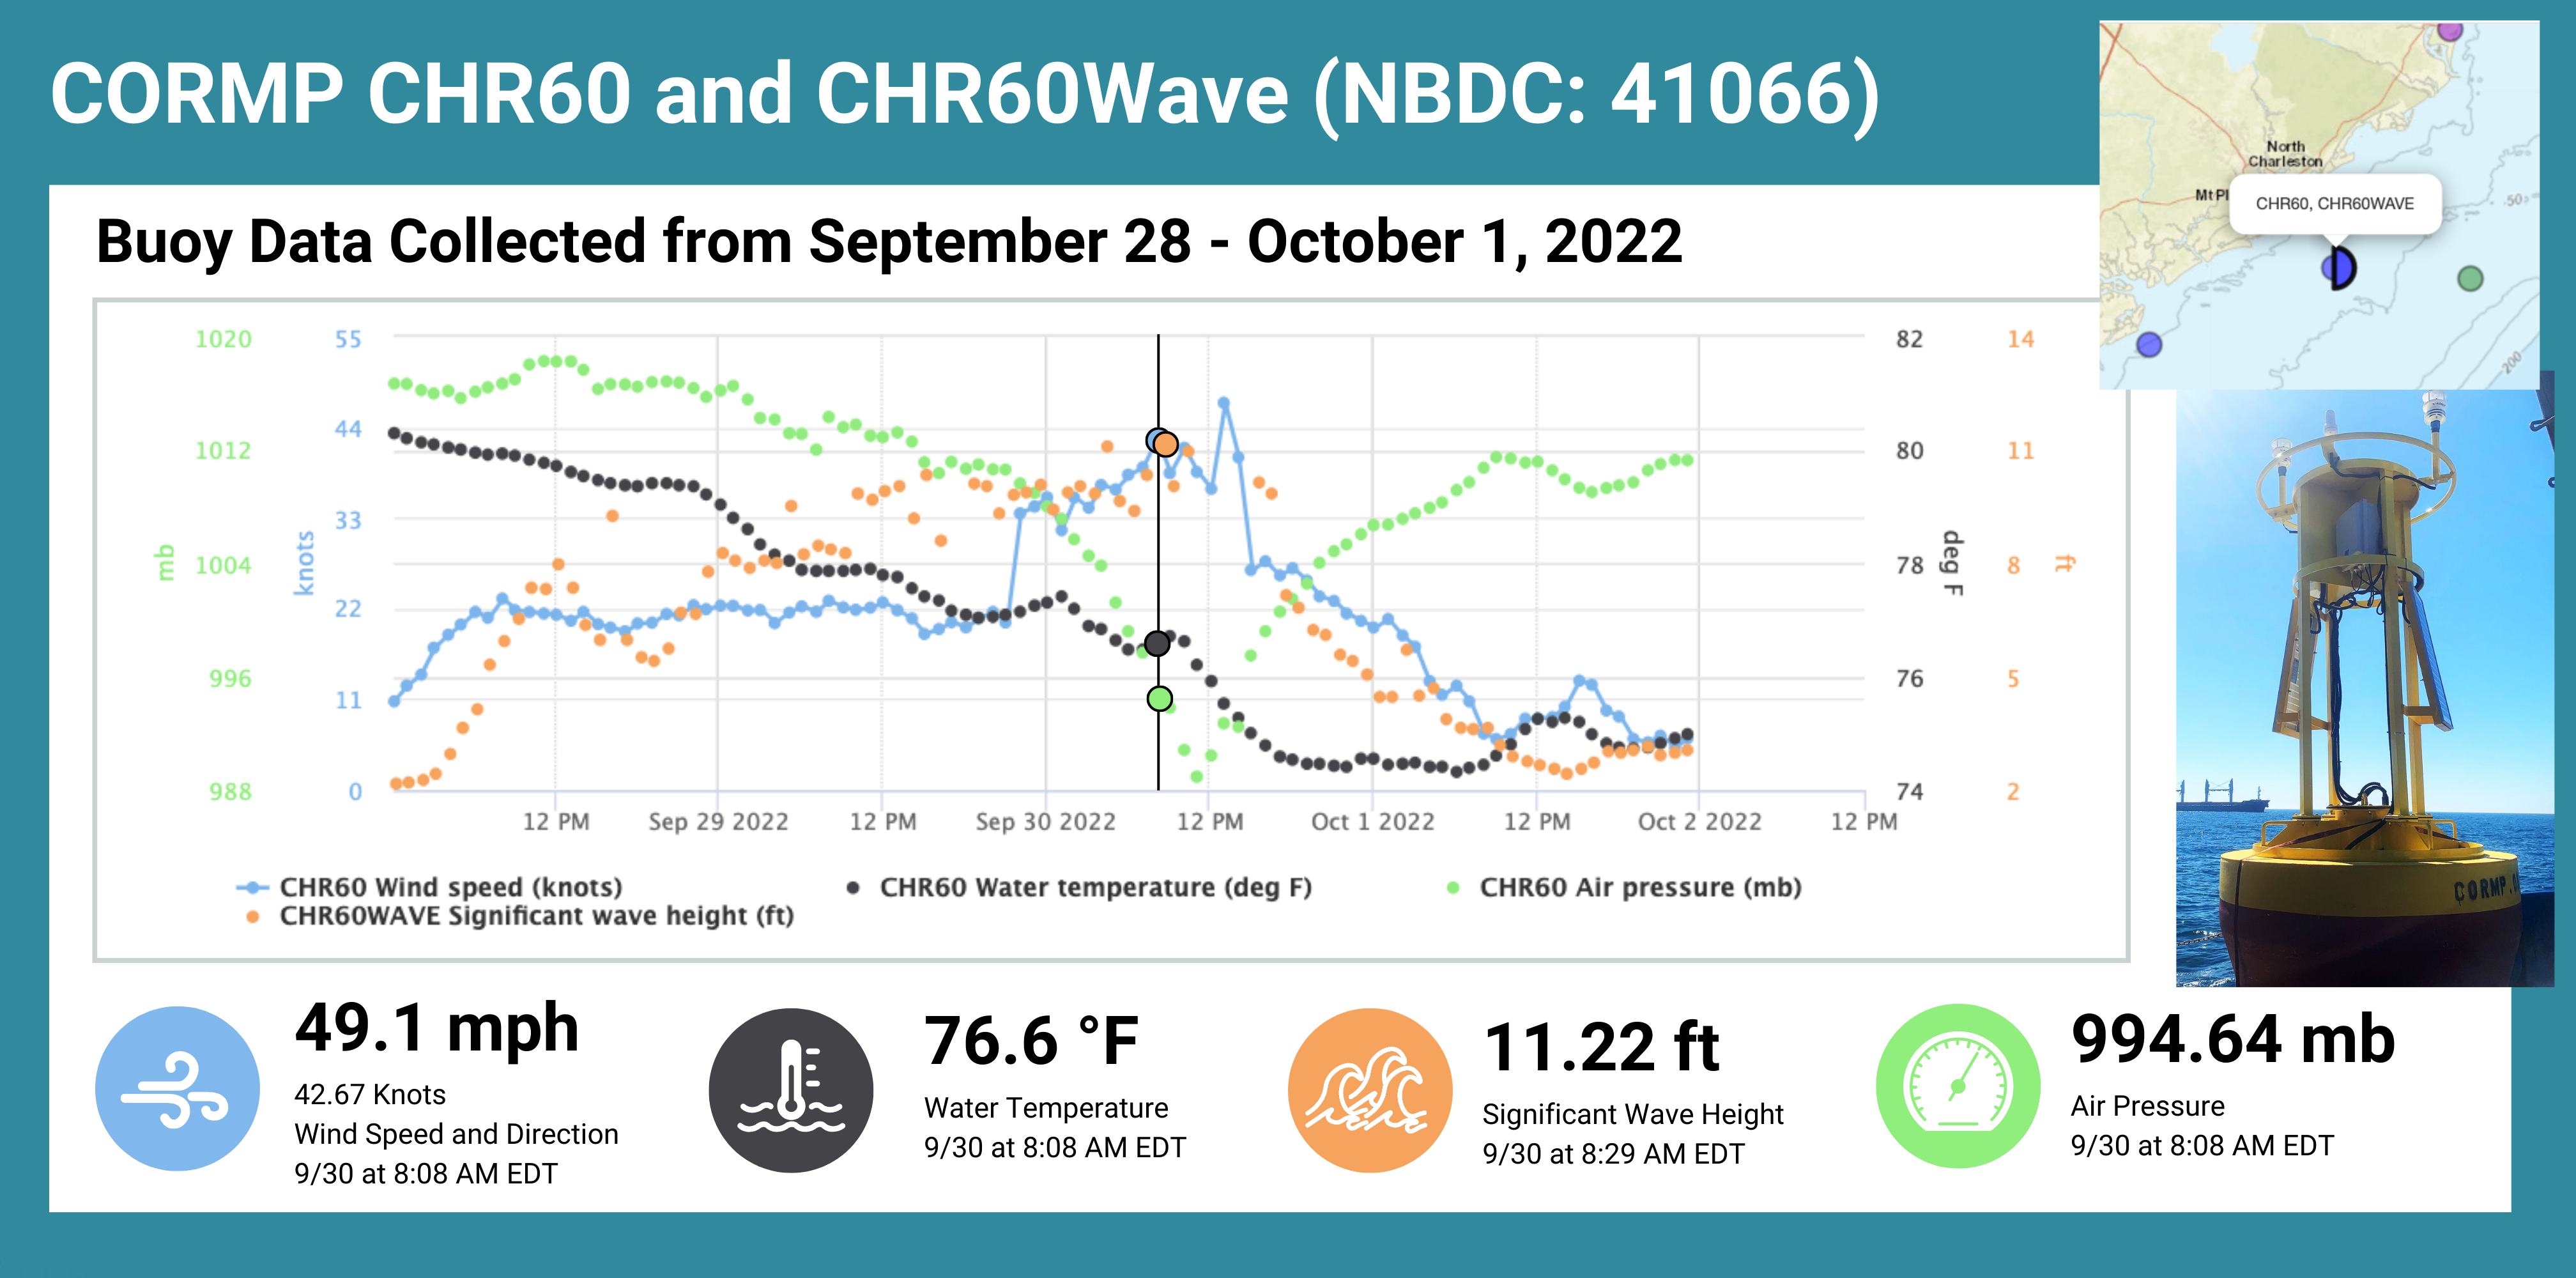
SECOORA funds operation of buoys off the Carolinas maintained by University of North Carolina Wilmington (UNC-W). These buoys captured Hurricane Ian’s effects as it made landfall in South Carolina. During the storm, UNC-W increased their buoy reporting frequency to allow for better surface analysis of the storm.
Pete Mohlin, NOAA National Weather Service Charleston Weather Forecast Office, said the data “showed where Ian might be going based on pressure and wind direction and aided in the forecast for rip currents based on wind direction, wind speed, wave height and wave period.”
Watching the Storm through Web Cameras
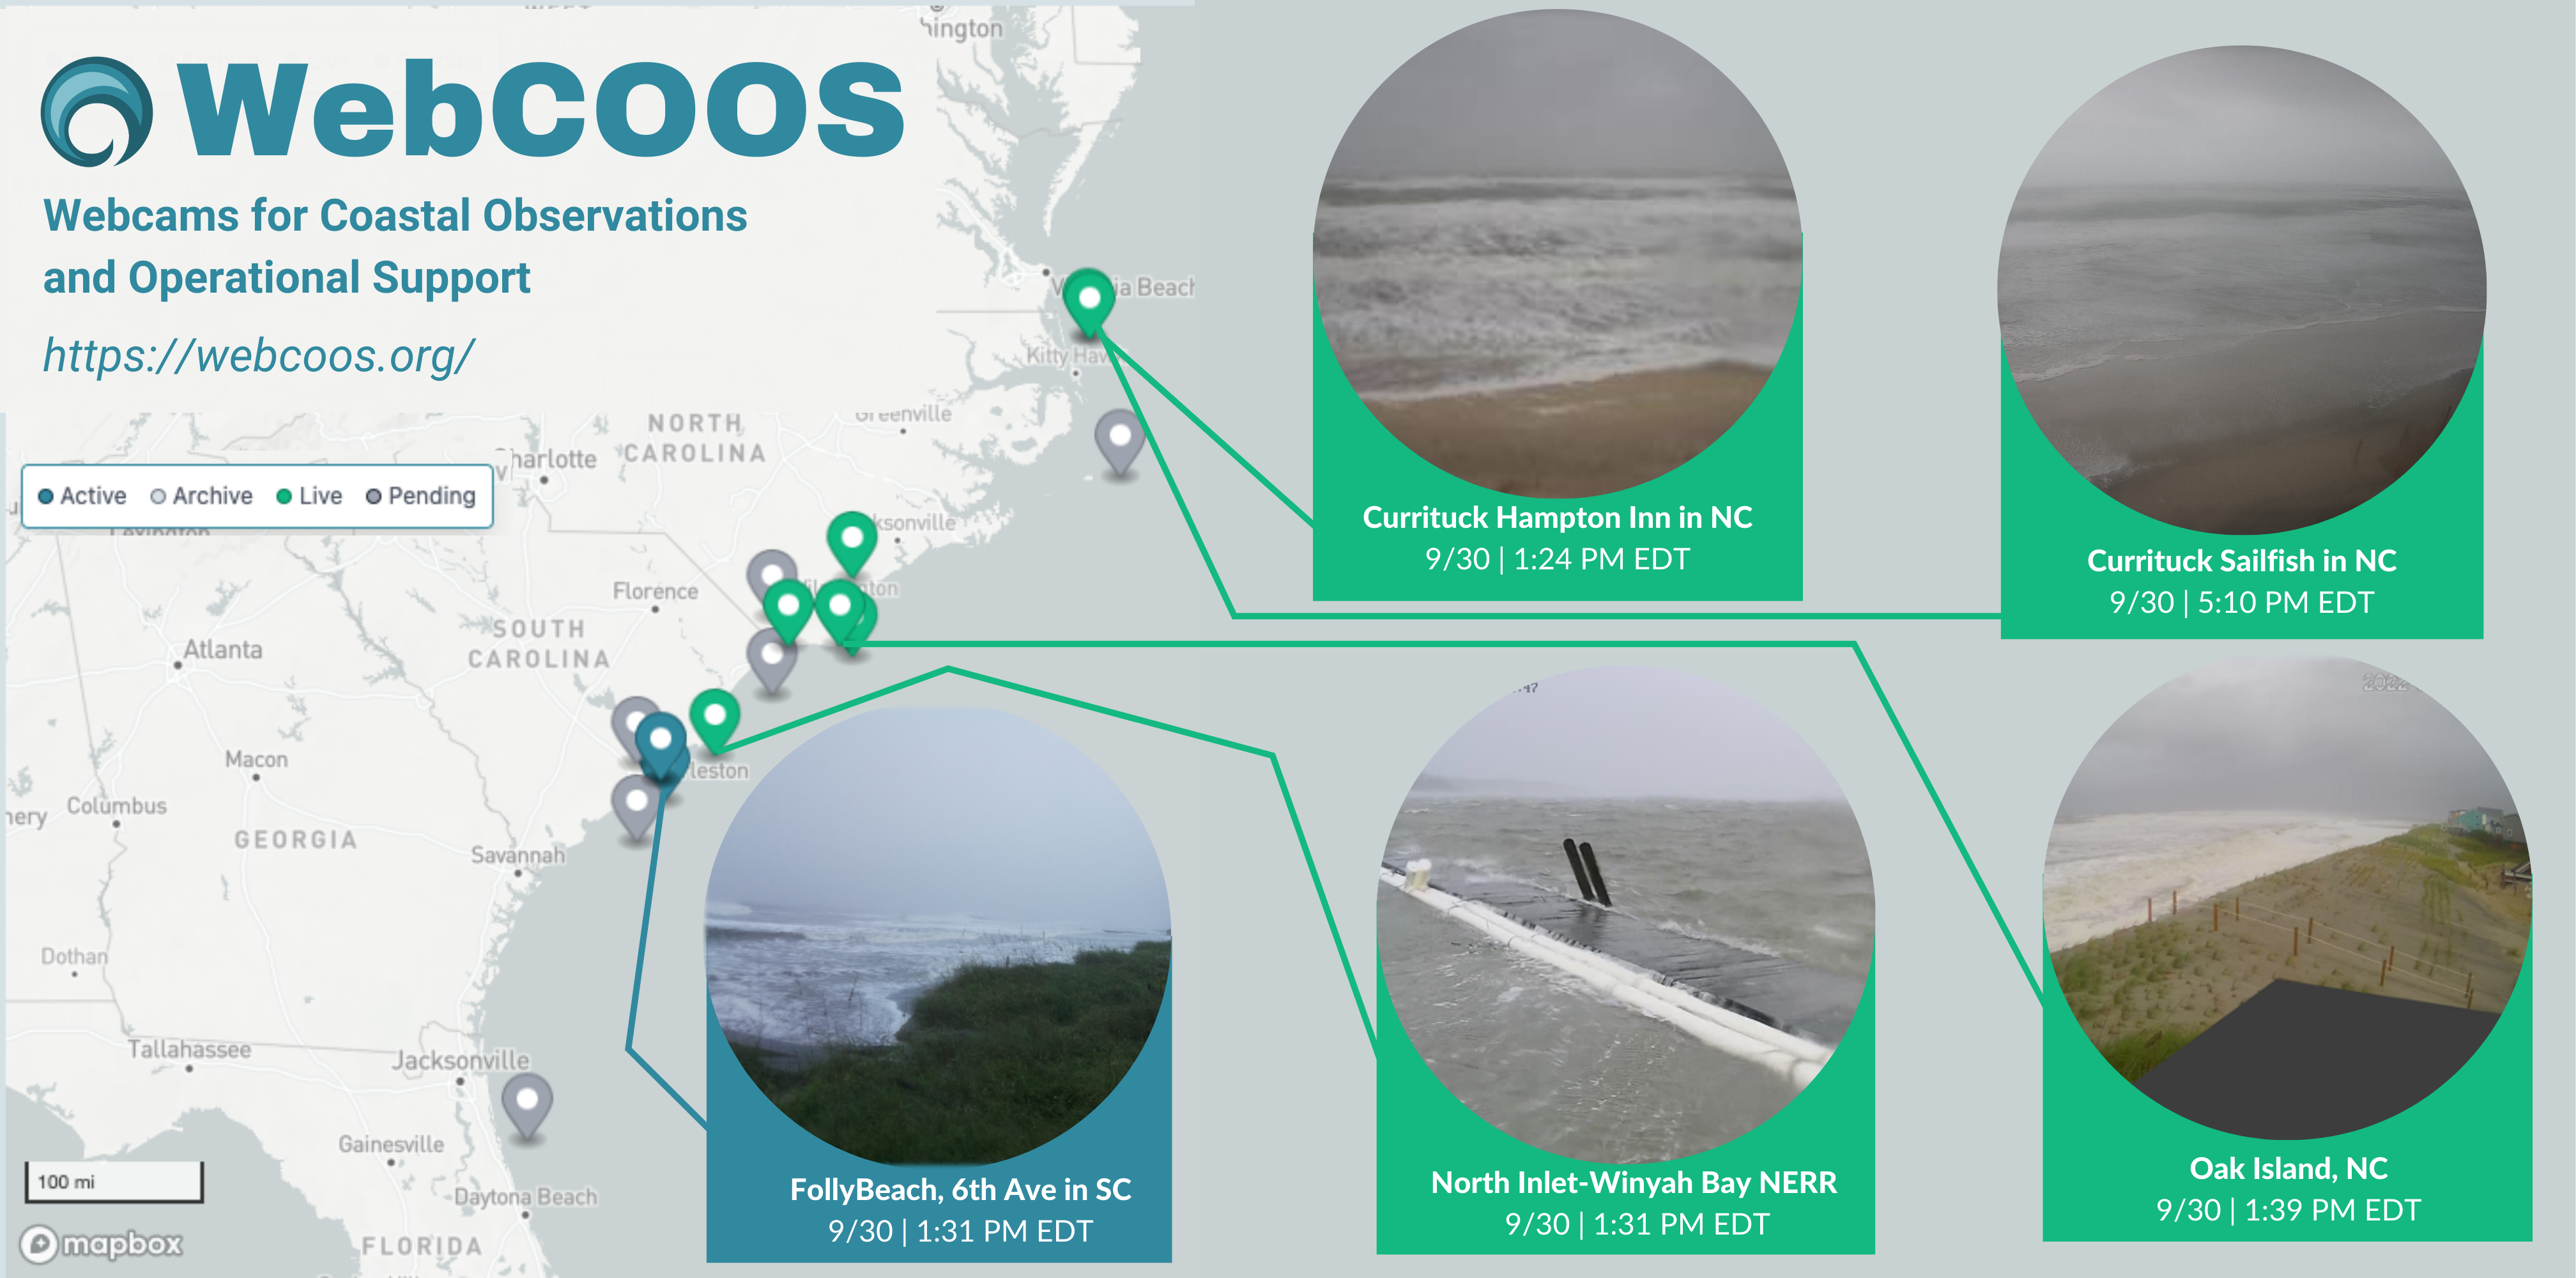
The WebCOOS (Webcamera Coastal Ocean Observing System) beta website was shared as Hurricane Ian was approaching. This new observing system allows users to stream live camera feeds in real-time in some locations, and see snapshot images in other locations. The cameras are being used to remotely monitor flooding, document the timing, duration, and extent of dune impacts, and predict rip currents.
The Rosemont community in Charleston, South Carolina is working with WebCOOS partners at the University of South Carolina Arnold School of Public Health to monitor flooding. The images captured by the Rosemont WebCOOS cameras were shared with the Charleston City Water Planning team to document extreme events’ impacts on the local neighborhood. WebCOOS-supported monitoring during before, during, and after Hurricane Ian are providing critical data for Rosemont leaders and residents to strengthen the community for disaster risk reduction, response, and recovery.
Tracking shoreline change and coastal evolution from WebCOOS cameras is a tool Joe Long from UNCW and his team are developing. A web camera was placed on Oak Island in North Carolina following a beach nourishment project. The time lapse video (above) shows overtopping of the recently vegetated dune in Oak Island, NC during Hurricane Ian.
Measuring and Predicting Water Levels
Water level stations supported by partners in SECOORA’s new water level network captured water levels throughout the passage of Hurricane Ian. Data from these water level stations are experimental and will be verified in time for next year’s hurricane season.
Water level sensors maintained by Hohonu were close to where Hurricane Ian made landfall. The sensors (not designed to be submerged) were inundated by the surge, stopped transmitting for some time while the telemetry antenna was likely submerged, then came back online reporting data as the flood waters receded.
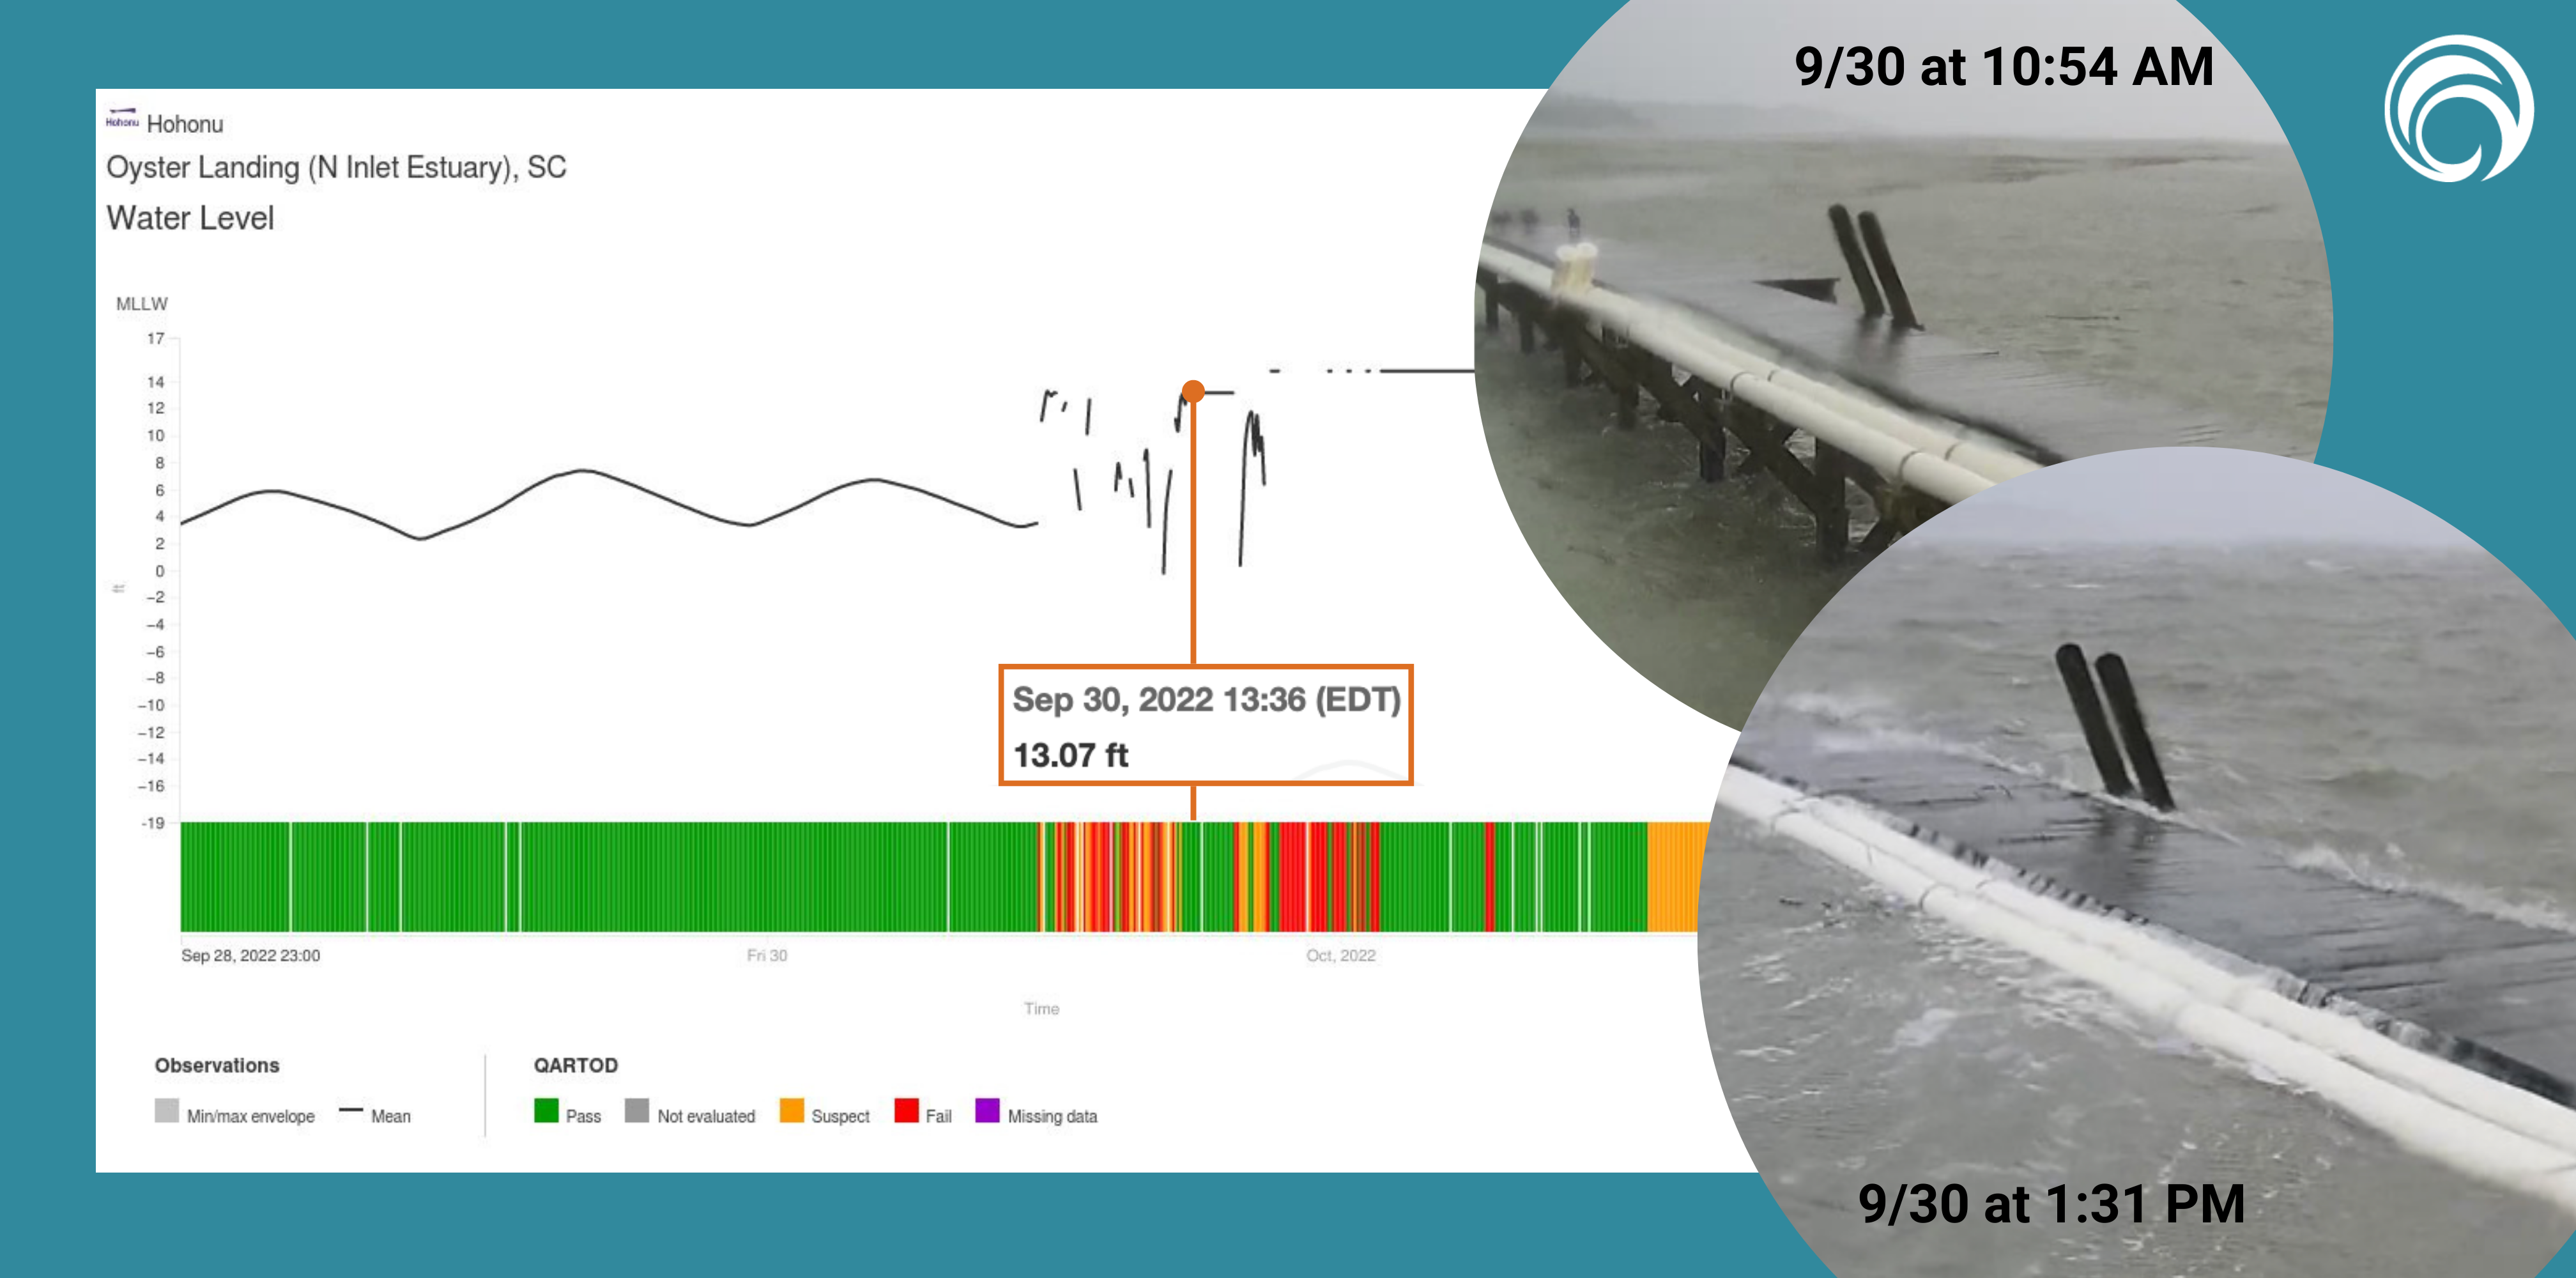
At the North Inlet-Winyah Bay National Estuarine Research Reserve System, a water level sensor maintained by University of South Carolina captured water level while a nearby web camera streamed images of the shoreline during the passage of the storm on webcoos.org.
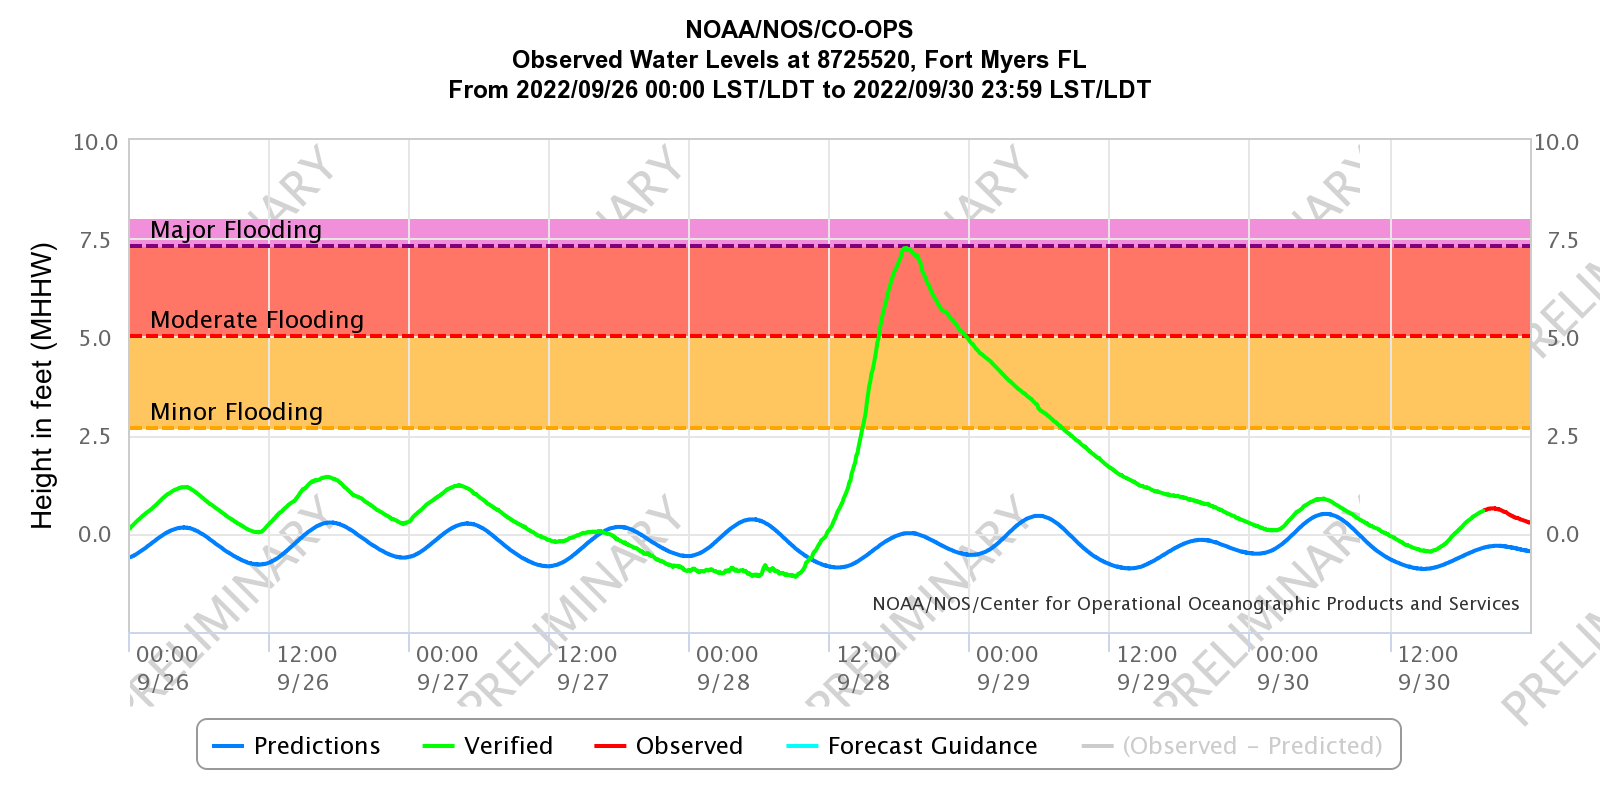
A water level station in Fort Myers, FL verified over 7 feet of storm surge on September 28. It is maintained by NOAA National Ocean Service Center for Operational Oceanographic Products and Services (NOAA CO-OPS). According to NOAA CO-OPS, this recording is nearly 4 feet greater than the previous record (2001 from Hurricane Gabrielle) for the 50+ year life of the water level station.
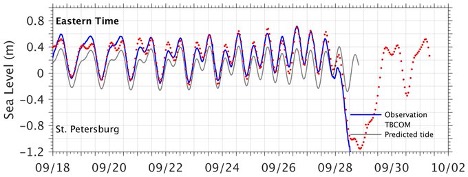
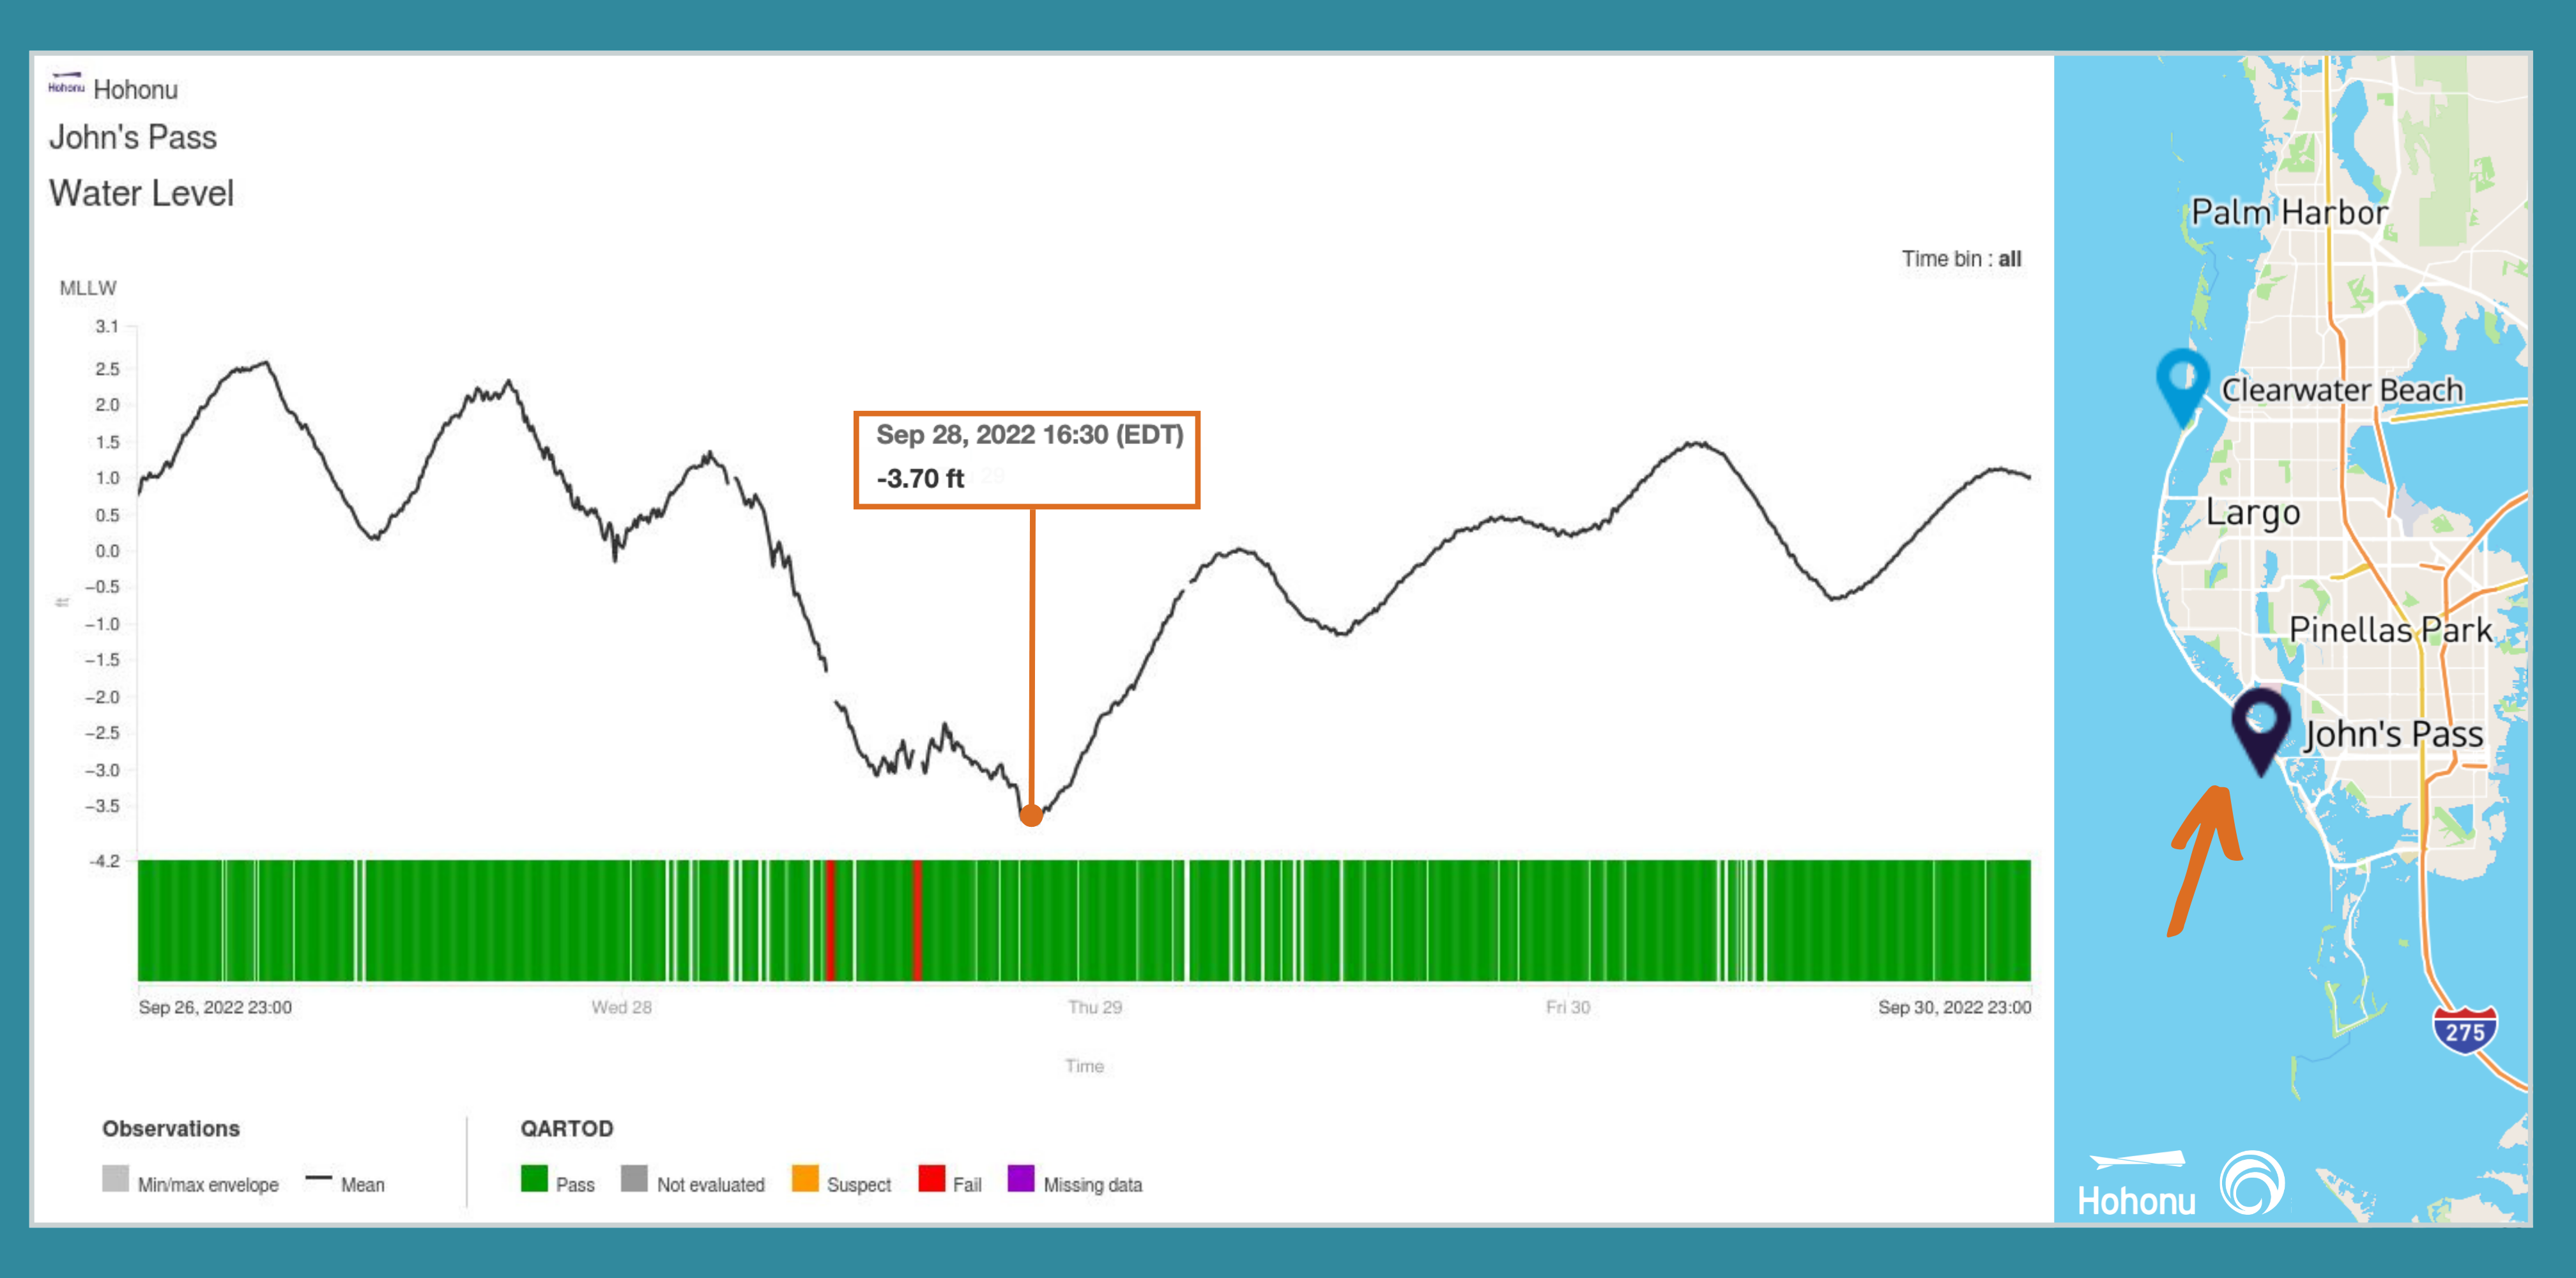
USF Ocean Circulation Lab issued a three and half day forecast that predicted water would be pushed out of the Tampa Bay Tampa Bay region based on their Tampa Bay Coastal Ocean Model (TBCOM) daily nowcast/forecast.
The model correctly predicted that Tampa Bay would experience negative storm surge.
Follow the Data
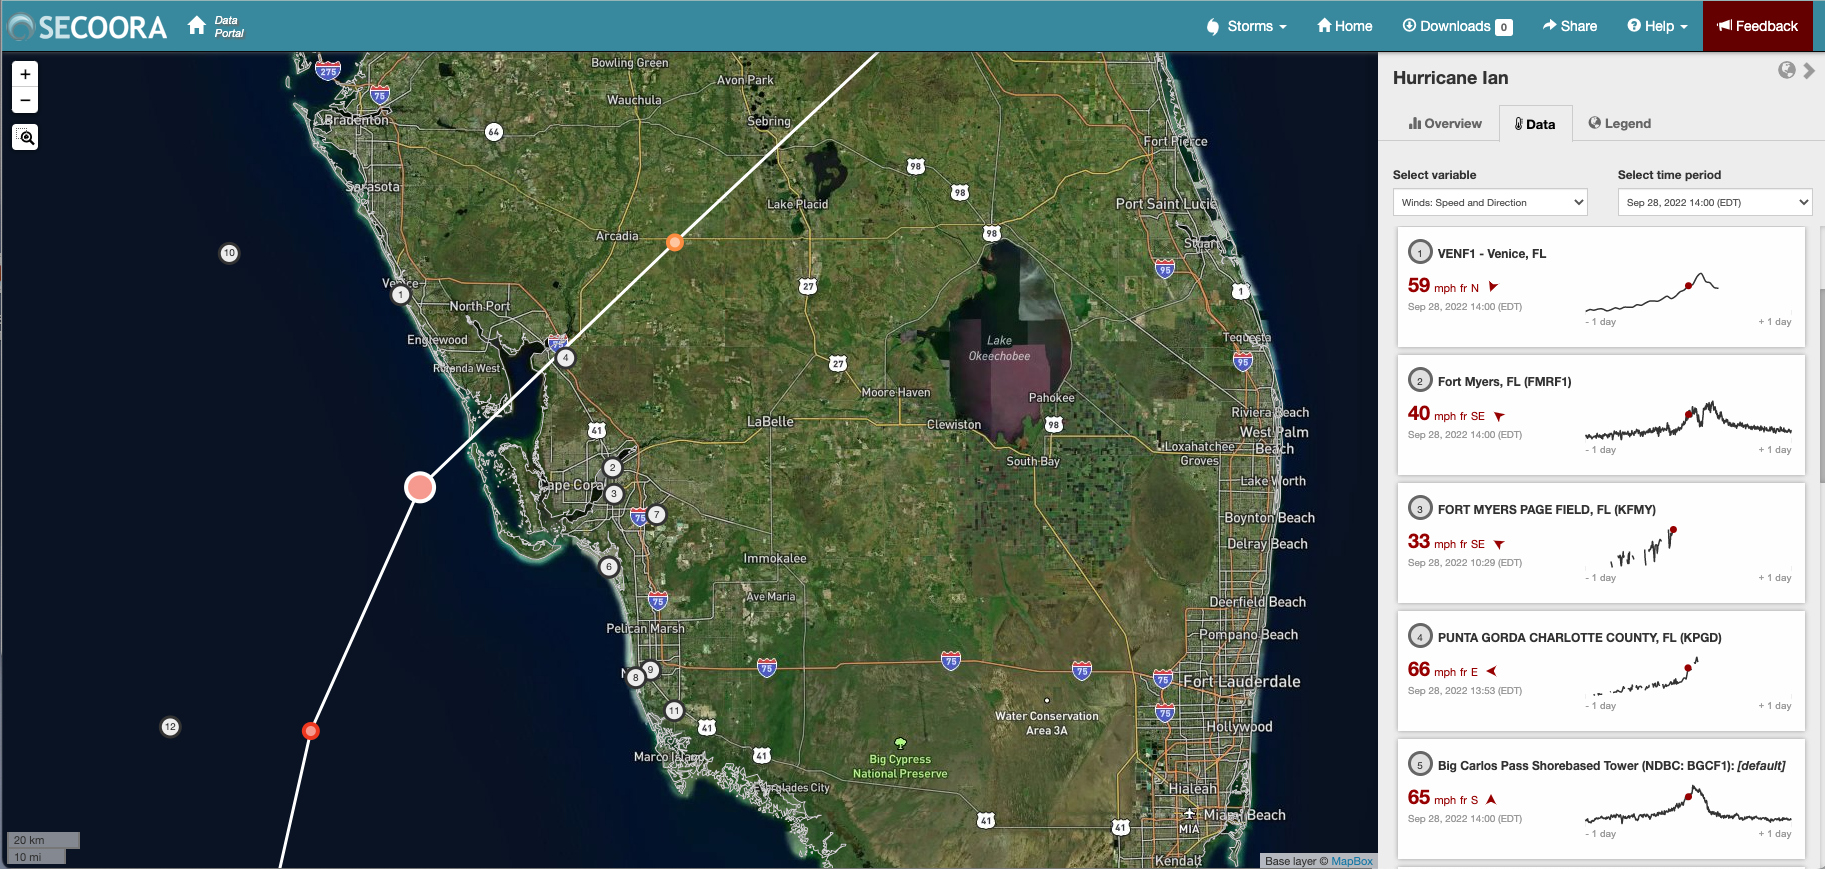
Eyes on the Storm pulls data from within 50 miles of Hurricane Ian’s path and showcases the highest wind speeds and wave heights and lowest barometric pressure. Big Carlos Pass Shorebased Tower (NDBC: BGCF1) maintained by USF COMPS captured 68mph wind speeds. Explore the data collected in the hurricane’s path.
If you have any question about the data or would like to learn more please contact Abbey at abbey@secooraorgpact.wpengine.com.
Related news
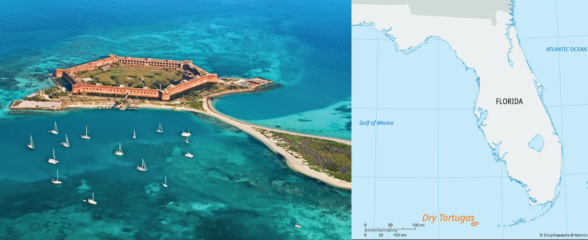
New High Frequency Radar at the Dry Tortugas National Park Improves Ocean Surface Current Measurements Across the Straits of Florida
A new CODAR Low-Power SeaSonde HFR has been deployed by the University of South Florida at Fort Jefferson on Garden Key to measure surface currents to improve understanding and prediction of the Gulf of Mexico Loop Current.
President Biden Proposes Significant Budget Cuts to IOOS for 2025
President Biden’s recent 2025 budget proposal slashed the funding allocated for the Integrated Ocean Observing System (IOOS) by 76%, which would effectively shut down coastal and ocean observing efforts.
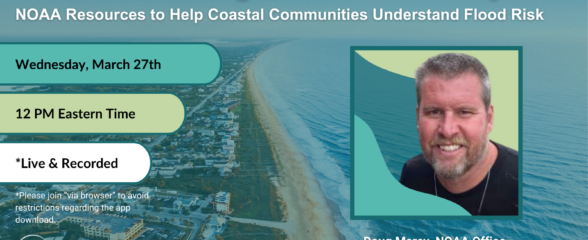
Webinar: NOAA Resources to Help Coastal Communities Understand Flood Risk
Join us Wednesday, March 27th at 12 PM Eastern Time for SECOORA's Coastal Observing in Your Community Webinar Series to hear from Doug Marcy with the NOAA Office for Coastal Management.