Written by Emily Noakes, SECOORA Communications Intern
Did you know that beaches and recreational waters can have health and safety hazards?
Rip currents are powerful currents that can carry swimmers away from shore.
Bacteria in the water can cause illness and indicate that other harmful pathogens may be present.
Harmful Algal Blooms (HABs) can cause respiratory irritation, skin rashes, and fish kills.
SECOORA helps support three free online decision-support tools that provide data on the health and safety of beaches and coastal waters in the Southeast. The three platforms are working to integrate their efforts to increase data accessibility and geographic range. Read below to learn what these sites have to offer.
Checking Water Quality Health with How’s The Beach (HTB)

Bacteria levels can rapidly change in coastal waters due to the introduction of stormwater runoff, pet and wildlife fecal matter, and human sewage. How’s The Beach, led by Dr. Dwayne Porter from University of South Carolina, predicts the daily risk of unsafe bacteria conditions at public beaches and recreational waters in the Southeast.
Beach managers analyze water samples and issue advisories if bacteria levels are harmful. However, these advisories are typically issued the day after samples are analyzed. A team of researchers, students, beach managers, and public health officials saw the need for daily predictions of bacteria levels. These predictions are based on known relationships between bacteria level and a suite of environmental measures including rainfall, salinity, wind conditions, and water temperature.
Below are the locations currently covered by How’s the Beach:
- North Carolina: Outer Banks and Radio Island
- South Carolina: Grand Strand, Surfside Beach, Charleston Harbor, and Folly Beach
- Florida: Sarasota and Manatee counties
How’s The Beach also provides UV and riptide advisories from the National Oceanic and Atmospheric Administration (NOAA) and the Environmental Protection Agency (EPA) along with current air temperature and wind conditions.
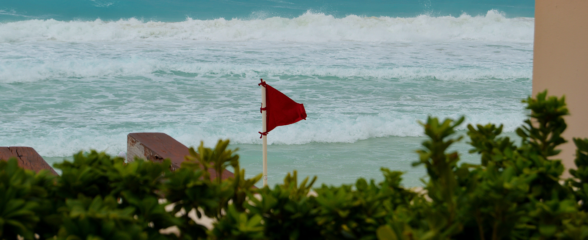
Avoid Hazards By Using the Beach Conditions Reporting System (BCRS)

Commuters often check traffic conditions before work, so why not check beach conditions before vacation? Led by Aspen Cook, the Beach Conditions Reporting System by Mote Marine Laboratory provides condition reports for beaches and coastal recreation areas. There are several sites located along the east and west coasts of Florida, two in South Carolina (Folly Beach and St. Helena Island), and two in Alabama (Gulf Shores and Orange Beach).
A red, yellow, or green flag designates the overall level of risk associated with the current beach conditions. Below are details that may be provided:
- Descriptions of wave activity and rip currents
- The type and amount of beach debris
- Signs of algae blooms/red tide, including water discoloration, respiratory irritation, and dead fish
- Automatically-generated weather information (including tide schedule)
This citizen-science program is supported by volunteer Beach Ambassadors that undergo training to make accurate condition reports. Community members can also submit reports that are validated by other users. Frequent beachgoers, lifeguards, and beach managers are welcome to sign up to be an Ambassador by undergoing a short online training program. Visit the BCRS site if you are interested in signing up.
Stay On Top of Shellfish Lease Closures with ShellCast
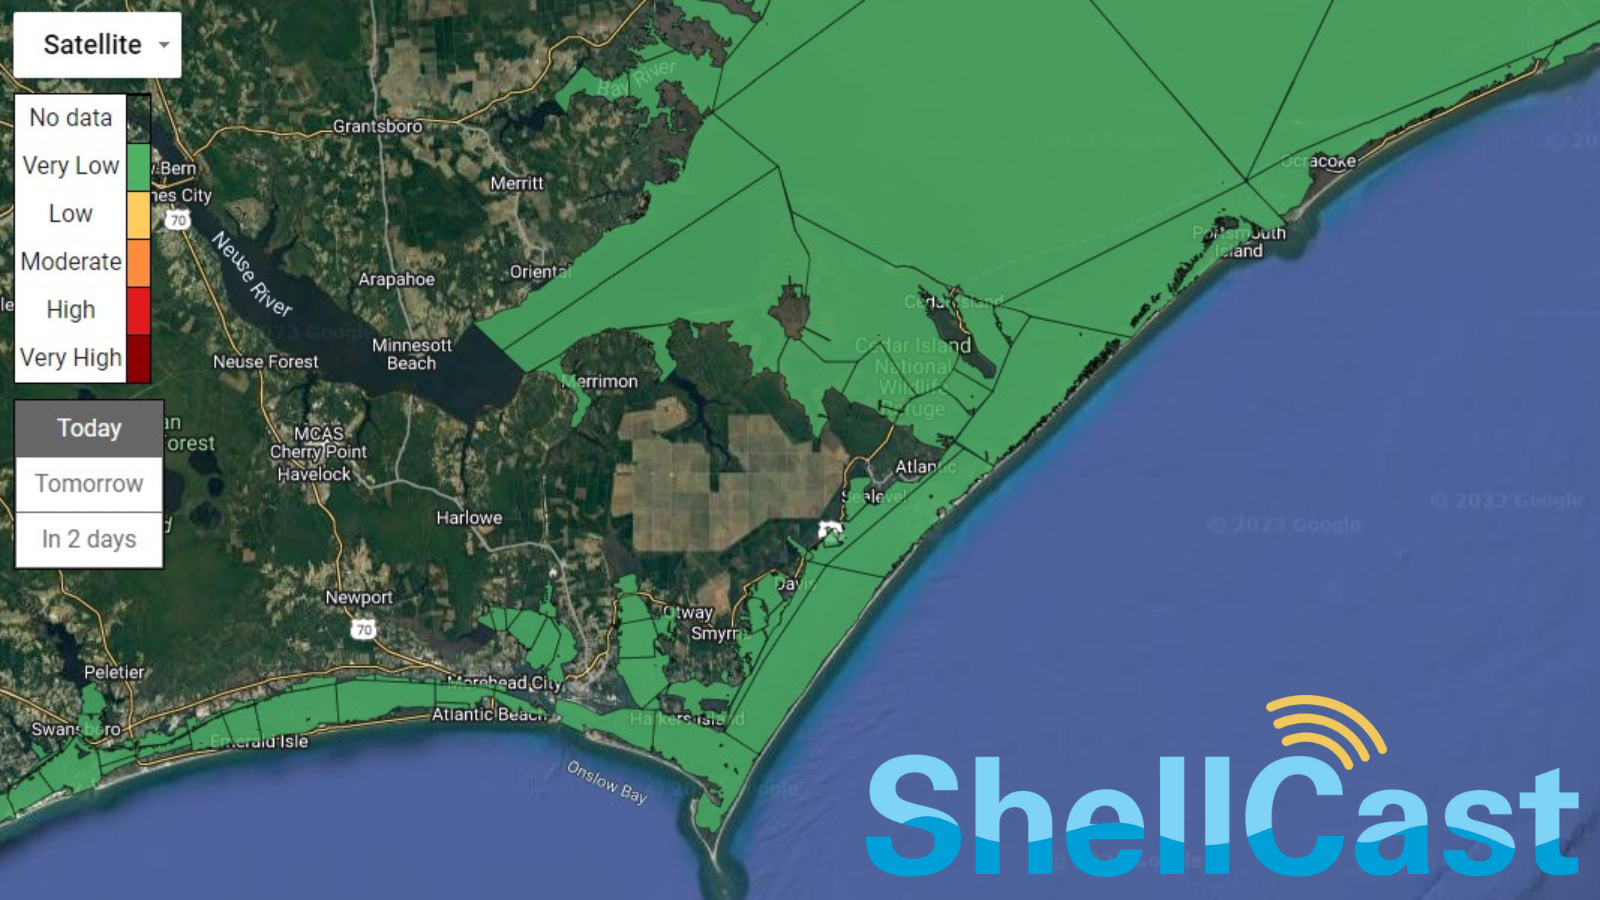
The livelihood of shellfish growers relies heavily on water quality conditions. ShellCast is a weather forecasting system created by Dr. Natalie Nelson and her team at North Carolina State University to alert shellfish growers about predicted lease closures.
Large amounts of rainfall can cause runoff to pollute the water of shellfish leases, potentially introducing contaminants. Because shellfish feed by filtering seawater, growing operations are shut down if poor water quality is suspected. This can happen suddenly, potentially causing growers to lose mass amounts of shellfish stock and revenue.
ShellCast uses rainfall predictions from the National Weather Service to predict shellfish lease closures a few days in advance to allow growers time to prepare. Predictions cover shellfish waters along the North Carolina coast and will expand to the South Carolina coast later this year.
ShellCast hopes to join forces with ShellBase to factor in historical water quality data to help improve lease closure accuracy in certain states. Learn about ShellBase here.
Joining Forces to Fight Data Gaps
These three websites are working together to collaborate and showcase each other’s data, increasing accessibility, user friendliness, data availability, and sharing of nowcasts and forecasts of water quality conditions. The integration of data from How’s the Beach, Beach Conditions Reporting System, and ShellCast will create new opportunities for people to learn how water quality affects others, whether they are beachgoers or shellfish growers.
“Working with the Beach Conditions Reporting System team has motivated us to think about ways we can engage shellfish growers in data reporting. Collaborating with the How’s the Beach web developers has sparked new ideas as to how we could improve our algorithms.”
– Dr. Natalie Nelson, NC State University
With this collaboration, How’s The Beach now contains information about shellfish lease closures from ShellCast, along with beach conditions that are reported on BCRS. BCRS is working with How’s The Beach and ShellCast to include information regarding bacteria levels on their platform.
There are plans for expansion of all three platforms, so look out for future change by bookmarking these sites and subscribing to our SECOORA newsletter!
Related news
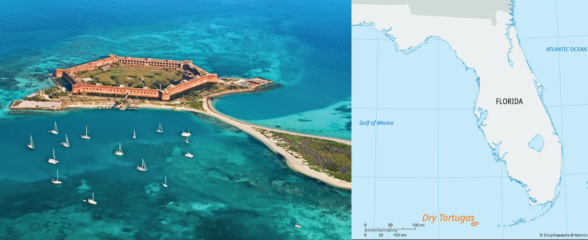
New High Frequency Radar at the Dry Tortugas National Park Improves Ocean Surface Current Measurements Across the Straits of Florida
A new CODAR Low-Power SeaSonde HFR has been deployed by the University of South Florida at Fort Jefferson on Garden Key to measure surface currents to improve understanding and prediction of the Gulf of Mexico Loop Current.
President Biden Proposes Significant Budget Cuts to IOOS for 2025
President Biden’s recent 2025 budget proposal slashed the funding allocated for the Integrated Ocean Observing System (IOOS) by 76%, which would effectively shut down coastal and ocean observing efforts.
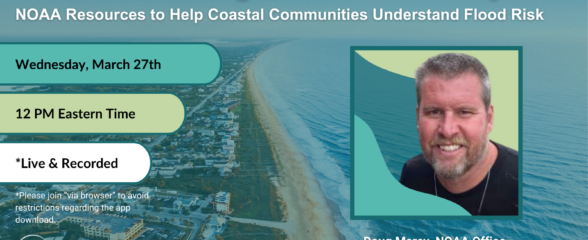
Webinar: NOAA Resources to Help Coastal Communities Understand Flood Risk
Join us Wednesday, March 27th at 12 PM Eastern Time for SECOORA's Coastal Observing in Your Community Webinar Series to hear from Doug Marcy with the NOAA Office for Coastal Management.