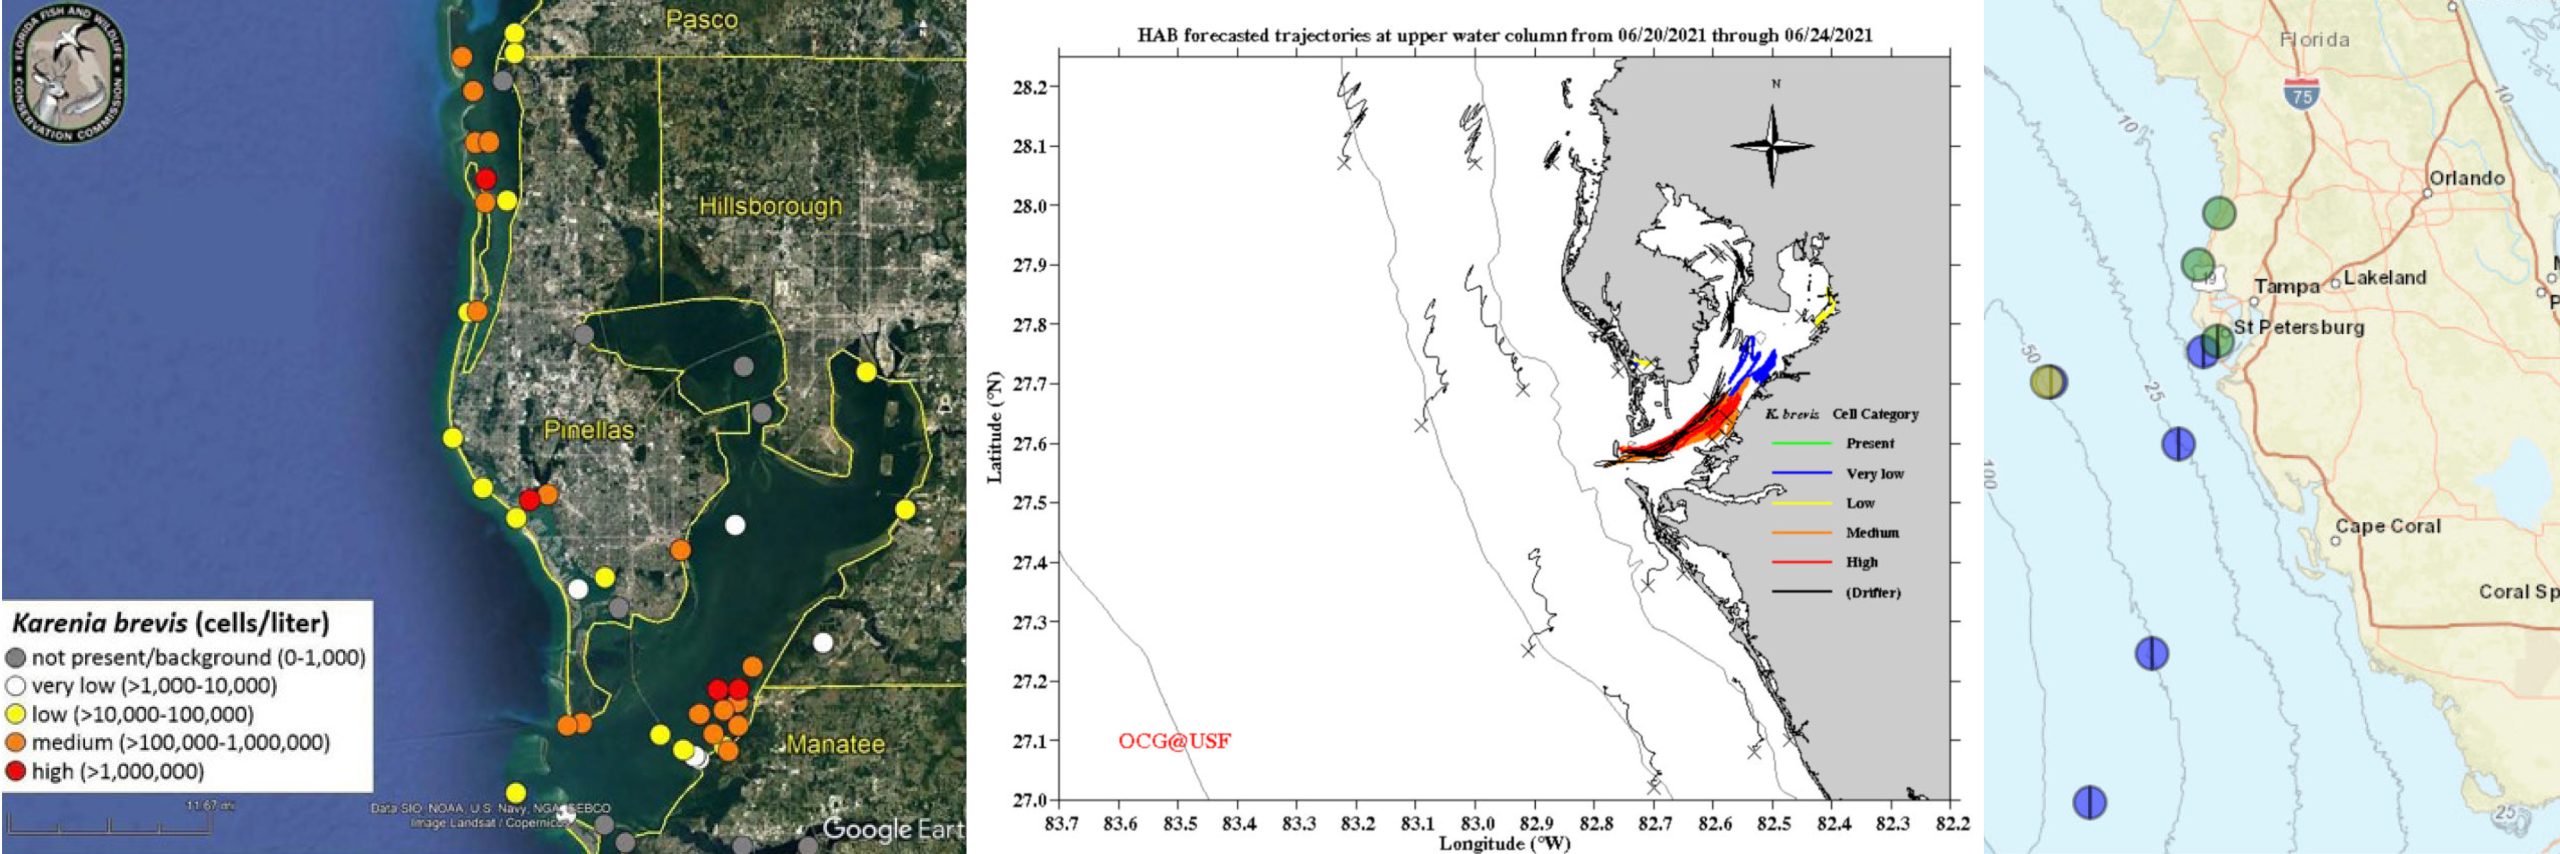
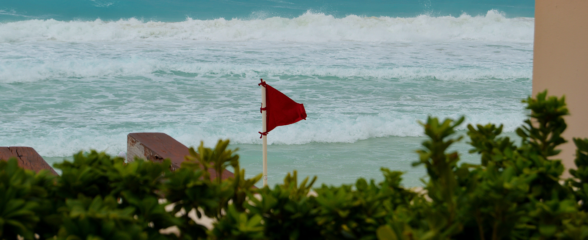
A red tide bloom is currently occurring in the greater Tampa Bay, FL region and is on the move northwards from Pinellas County. Blooms occur when concentrations of the toxic dinoflagellate, Karenia brevis, exceed 100,000 cells per liter.
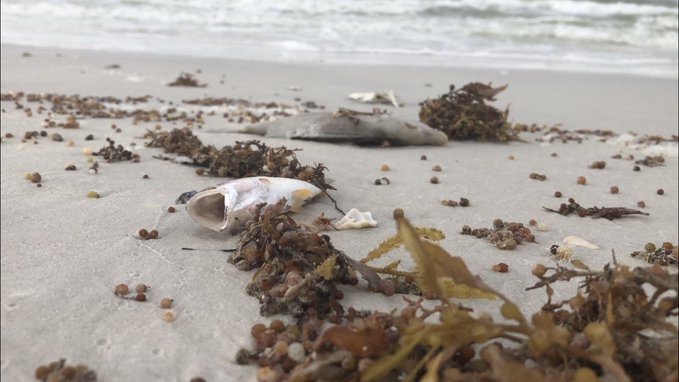
This harmful algal bloom (HAB) is leaving dead fish in its wake, and local officials in some areas are urging beach-goers to check the current bloom status and forecasts due to the mid-high risk for respiratory irritation in some areas, as well as patchy and rapidly changing conditions (explore GCOOS’s HAB Experimental Red Tide Respiratory Forecast for data).
SECOORA has compiled a list of red tide data resources and supports a number of projects currently tracking and modeling the bloom.
SECOORA members at the University of South Florida College of Marine Science (USF CMS), Florida Fish and Wildlife Conservation Commission Florida Wildlife Research Institute (FWC FWRI), and Mote Marine Laboratory are currently monitoring the bloom.
Predicting the bloom’s movement is critical to preparing communities for its arrival. The Red Tide Prediction and Tracking model from USF CMS Ocean Circulation Group, led by Dr. Robert Weisberg, uses cell counts provided by FWC FWRI along with oceanic and atmospheric observations to provide short-term (3.5 day) trajectory forecasts of red tide for the west coast of Florida. The model results highlight surface and near bottom water movement which is important for showing where red tide may be transported.
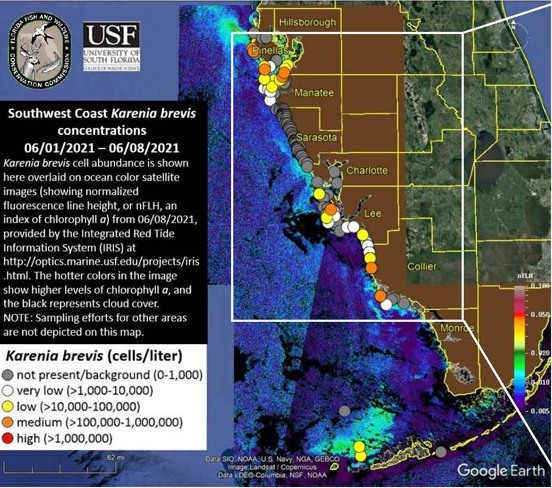
Customized satellite data provided by Dr. Chuanmin Hu’s Optical Oceanography team at USF CMS allows further insight into where cells might be by providing maps of surface chlorophyll, a proxy for algal biomass. This data can be accessed in an Integrated Red Tide Information System (IRIS) and assists in coordinating sampling missions during red tide research cruises.
During blooms, FWC FWRI presents the 3.5 day bloom trajectory forecasts and satellite data as part of biweekly red tide status updates which are distributed to managers, researchers, and citizens via an email listserv and the “Florida Red Tide and Other Harmful Algal Blooms” Facebook page.
SECOORA also funds USF’s buoy and coastal station operations on the West Florida Shelf, collectively known as the Coastal Ocean Monitoring and Prediction System (COMPS). The buoys and coastal stations provide real-time data on surface meteorology, currents, and water level. These observations are critical input for HAB forecasts.
Other user-friendly monitoring work available from SECOORA members includes Mote Marine Lab’s Beach Condition Report and the Florida Fish and Wildlife Conservation Commission (FWC) daily-updated status map.
Related news
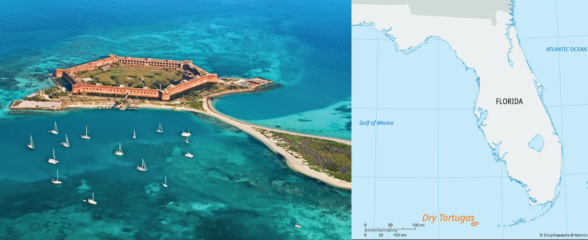
New High Frequency Radar at the Dry Tortugas National Park Improves Ocean Surface Current Measurements Across the Straits of Florida
A new CODAR Low-Power SeaSonde HFR has been deployed by the University of South Florida at Fort Jefferson on Garden Key to measure surface currents to improve understanding and prediction of the Gulf of Mexico Loop Current.
President Biden Proposes Significant Budget Cuts to IOOS for 2025
President Biden’s recent 2025 budget proposal slashed the funding allocated for the Integrated Ocean Observing System (IOOS) by 76%, which would effectively shut down coastal and ocean observing efforts.
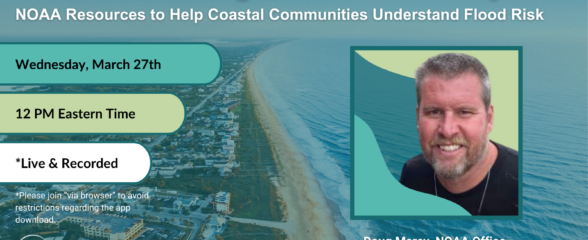
Webinar: NOAA Resources to Help Coastal Communities Understand Flood Risk
Join us Wednesday, March 27th at 12 PM Eastern Time for SECOORA's Coastal Observing in Your Community Webinar Series to hear from Doug Marcy with the NOAA Office for Coastal Management.