
Featured Resource
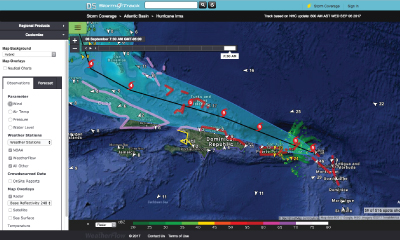
Eyes on the Storm connects you to real-time and historical hurricane data. Pulling data within a 50-mile radius of a hurricane’s path, it showcases peak wind speeds, wave heights, and lowest barometric pressure. Click on the storm to access data.
SECOORA and Member Data
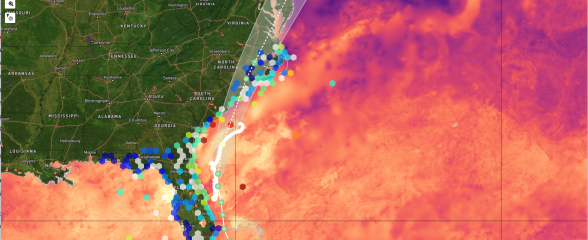
SECOORA Data Portal
The SECOORA Data portal allows users to explore, download and visualize ocean and coastal data in the SECOORA domain. When a storm is approaching, check out the sensors map to see the storm data in real time.
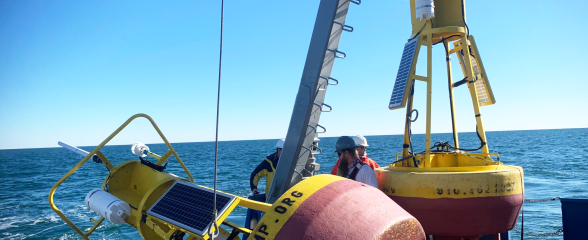
Buoy Data – Southeast Atlantic Coast
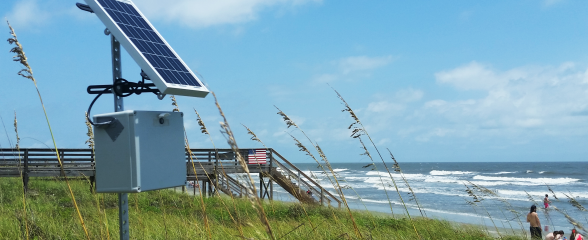
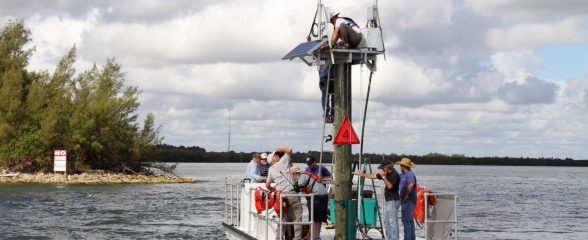
The University of North Carolina Wilmington’s Coastal Ocean Research and Monitoring Program operates mooring stations in North Carolina, South Carolina, and the east coast of Florida.
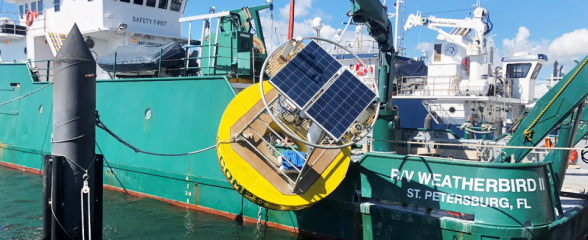
Buoy and Coastal Data – West Florida Shelf
University of South Florida’s Coastal Ocean Monitoring and Prediction System consists of an array of instrumentations along the West Florida Shelf. The information collected provides real time updates on the storm’s wind speed and more.
Webcam Coastal Observation System (WebCOOS)
This new observing system allows users to stream live camera feeds in some locations, and see snapshot images in other locations. The cameras are being used to remotely monitor flooding, document the timing, duration, and extent of dune impacts, and predict rip currents.
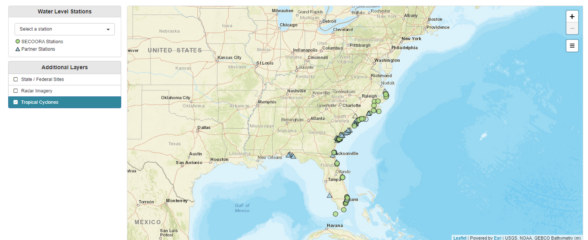
Water Level Data Portal - SECOORA and Partners
This map shows the locations of water level stations in the Southeast. By turning on the "Tropical Cyclone" layer, you can follow storms as they pass the stations.
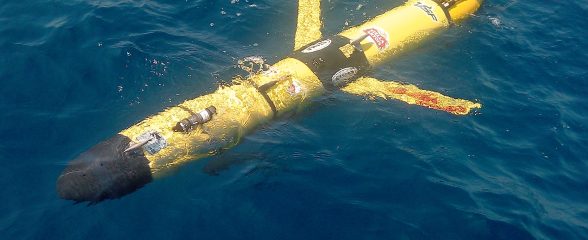
Improving Hurricane Forecasting with Gliders
During the 2023-2025 hurricane seasons, gliders are deployed in the Southeast and beyond to provide valuable data for hurricane intensity modeling. Glider deployments collect temperature and salinity profiles needed to accurately represent ocean features in ocean-atmosphere coupled models used for hurricane intensity forecasts.
Indian River Lagoon Observatory (IRLON)
IRLON is operated by the Indian River Lagoon Observatory which is based at Harbor Branch Oceanographic Institute at Florida Atlantic University in Fort Pierce, Florida. Access real-time, high-accuracy and high-resolution water quality and weather data.
Altimeter-Derived Atlantic Oceanic Heat Content Variability
Ocean heat helps fuel storms. The satellite derived sea surface temperature maps represents the integrated heat from the surface to the seafloor. Operated by Nick Shay, University of Miami Rosenstiel School of Marine and Atmospheric Science.
Hurricane Tracking
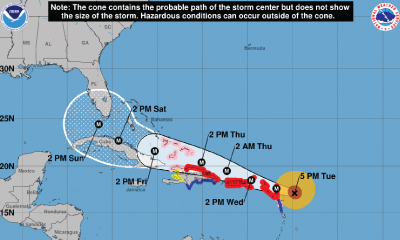
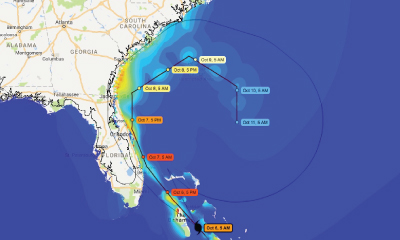
NOAA National Hurricane Center
The National Hurricane Center (NHC) is the trusted source for hurricane information. Resources include predicted storm tracks and wind speed probabilities.
NOAA GOES Satellite Imagery
Explore near-real-time state of the atmosphere satellite images of hurricanes in a variety of band combinations and short loops. A new “Storms” tab highlights the active and past storms. These images are one input used to predict weather.
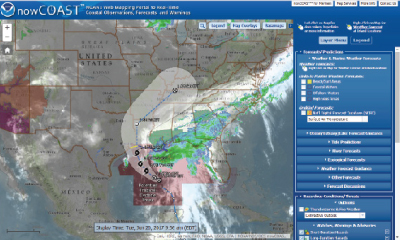
NOAA’s nowCOAST
NOAA’s nowCOAST is a GIS-based online web mapping service which provides frequently updated weather and ocean observations, coastal and marine weather warnings and forecasts, and National Hurricane Center potential storm surge flooding maps.
WeatherFlow StormTrack
StormTrack allows you to see the latest predicted track of an identified storm. By using their wealth of real time observations, meteorological tools, and precision models, you can see exactly how each storm is progressing. Each storm page grants access to premium level data for the duration of the storm.
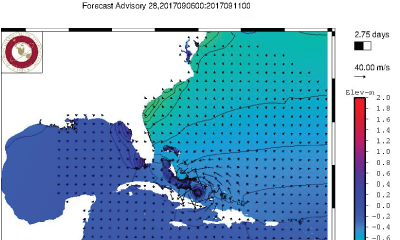
Real Time Florida Coastal Guidance
Real time coastal wind, wave, and water level guidance is presented for the east central Florida coast, focusing on the Indian River Lagoon and Brevard County. Model products available on the site include: ADCIRC+SWAN numerical model using NOAA’s North American Mesoscale (NAM) model and the latest forecast/advisory from the National Hurricane Center (NHC).

Jyotika’s Tropical Storm Blog
A fun and educational blog concerning tropical storms and witty weather forecasting. From baby blobs to hectic hurricanes, this blog combines science and humor to inform and entertain.
Storm Surge, Flooding, and Coastal Change
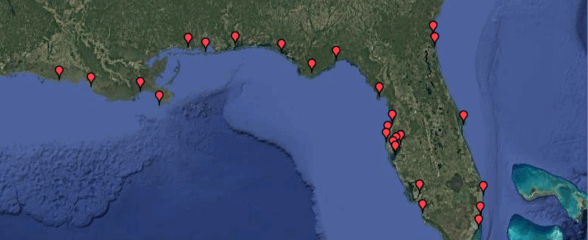
USF Unified Water Level (Storm Surge) Forecast Guidance Product
This water level forecast guidance product is derived from three numerical models: the West Florida Coastal Ocean Model (WFCOM), the Tampa Bay Coastal Ocean Model (TBCOM), and the East Florida Coastal Ocean Model (EFCOM), all configured to perform realistic simulation of coastal ocean circulation and run as automated nowcast/forecast systems that updates daily.
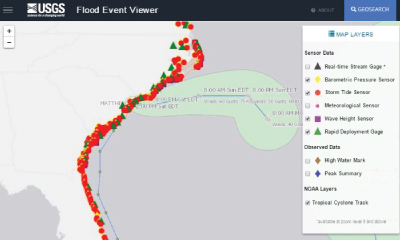
USGS Flood Event Viewer
The USGS Flood Event Viewer (FEV) is the public data discovery component of the Short-Term Network (STN) database. It features 200+ USGS storm surge sensors and rapid deployment real-time gauges.
Coastal Emergency Risks Assessment
CERA is a component of the Advanced Surge Guidance System (ASGS). Based on the Advanced Circulation and Storm Surge model (ADCIRC), coupled with the SWAN Wave model, the ASGS generates real-time storm surge guidance for updating emergency response groups during a tropical or hurricane event.
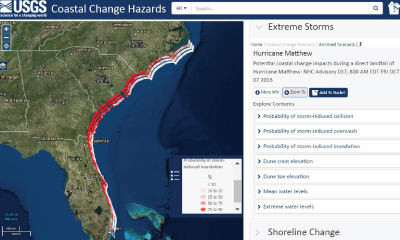
USGS Coastal Hazards Portal
U.S. Geological Survey’s (USGS) Coastal Change Hazards Portal is an interactive portal that allows you access to forecasts on the probability of dune erosion, overwash, and inundation/flooding. The portal also allows you to view previous storm impacts. The portal is updated regularly as new NOAA surge forecasts are issued and include the impacts of waves and wave runup.

North Carolina Flood Inundation Mapping and Alert Network (FIMAN)
The North Carolina Flood Inundation Mapping and Alert Network (FIMAN) is a user-friendly, risk-based, decision support system for floods that includes flood inundation maps, flooding impacts, and alert warnings based on rainfall and water level data.
IOOS Regional Associations
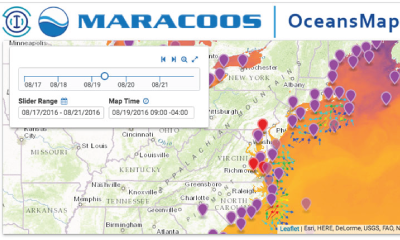
MARACOOS Storm Resource Center
The IOOS region in the Mid-Atlantic, MARACOOS, operates a storm resource page for the East Coast.
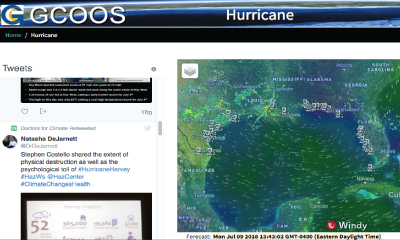
GCOOS Hurricane Resource Page
The IOOS region in the Gulf of Mexico, GCOOS, has a one-stop location for Gulf of Mexico data and information on extreme weather event such as hurricanes.
CariCOOS Hurricane Season Page
The IOOS region in the Caribbean, CariCOOS, has a Hurricane Season page the produces the most up to date information on hurricanes in the Atlantic.
NOAA Historical Hurricane Tracks Tool
This interactive tool can be used to view, analyze, and share historical hurricane tracking information for over 13,000 storms dating back to the 1800’s. Search hurricanes by location, name, year, or basin, and customize your search using filters to view technical reports and storm details.