Upcoming Webinars
| Date | Webinar Title | Presenter | Registration | Website |
|---|
Archived Webinars
| Date | Title of Webinar (click on title to view video) | Presenter(s) |
|---|---|---|
| April 4, 2023 | Mote Marine Laboratory’s Beach Conditions Reporting System | Aspen Cook, Mote Marine Laboratory |
| March 7, 2023 | USGS Water Observing Systems Network & Response to 2022 Tropical & Extratropical Storms | Athena Clark and Brian McCallum, United States Geological Survey (USGS) |
| October 25, 2022 | Sargassum Watch from Space | Dr. Chuanmin Hu, College of Marine Science, University of South Florida |
| September 27, 2022 | ShellBase: Water Quality Data from Shellfish Harvest Waters in One Database | Natalie Nelson, North Carolina State University Megan Carr, North Carolina State University Natalie "Nat" Chazal, North Carolina State University |
| June 28, 2022 | Lake Okeechobee harmful algal bloom & water quality monitoring with Nav2 Sail & Solar ASV | Scott Duncan, Navocean Inc Veronica Ruiz Xomchuk, Harbor Branch Oceanographic Institute |
| June 21, 2022 | A High resolution Ocean Reanalysis of the Northwest Atlantic in Support of Climate Change Studies | Dr. Ruoying He, North Carolina State University |
| January 25, 2022 | Predicting High Cross Currents Near South Florida Ports Using Machine Learning | Dr. Steven D. Meyers, University of South Florida College of Marine Science Mark E. Luther, University of South Florida College of Marine Science |
| October 26, 2021 | It’s hot! How temperature is impacting Spotted Seatrout and seagrass in Florida Bay | Jonathan Rodemann, Florida International University Ph.D. Candidate |
| June 22, 2021 | Applying Technology to Improve our Ability to Forecast, Observe and Detect Rip Currents | Grek Dusek, NOAA, National Ocean Service Alex Pang, University of California Santa Cruz |
| April 27, 2021 | 4th Grade Curriculum: Water Shapes Our Planet and Our Lives | Katy Smith, Jill Gambill, and Nina Sassano (University of Georgia Marine Extension and Georgia Sea Grant) |
| March 23, 2021 | Making the Data Work for You | Lauren Showalter and Brian Stone, Axiom Data Science |
| February 23, 2021 | Regional Ocean Data Sharing Southeast Sand Resources Project | Mary Conley, The Nature Conservancy |
| January 26, 2021 | The Trouble with Deep Learning | Paul Gader, University of Florida |
| December 15, 2020 | Developing an Integrated Coastal Water Predictive Capability to Promote Resilience | Ruoying He, North Carolina State University Jennifer Dorton, SECOORA Charlton Galvarino, Second Creek Consulting |
| November 17, 2020 | What’s all that racket! Estuarine soundscapes in South Carolina | Eric W. Montie, M.S., Ph.D., University of South Carolina Beaufort |
| February 27, 2018 | Next Generation SECOORA Data Portal | Stacey Buckelew and Brian Stone, Axiom Data Science |
| February 28, 2017 | Coastal Ocean Circulation Influences on Matters of Societal Concern | Dr. Bob Weisberg, University of South Florida College of Marine Science |
| October 5, 2022 | Georgia Virtual Data Workshop: Discovering and Accessing Coastal and Ocean Data | SECOORA, Axiom Data Science, and Sapelo Island National Estuarine Research Reserve, NOAA National Estuarine Research Reserves System |
| August 25, 2020 | Observations on the West Florida Shelf Pressure Point | Dr. Bob Weisberg, University of South Florida College of Marine Science |
| July 28, 2020 | Establishing Baselines for Benthic Habitat and Fish Populations on the West Florida Shelf | Dr. Steven Murawski, Chad Lembke, Sarah Grasty, and Alex Ilich – University of South College of Marine Science |
| June 23, 2020 | Coastal 3-D high-resolution maps for floods, wetlands, and biodiversity | Dr. Matt McCarthy, Oak Ridge National Laboratory |
| May 26, 2020 | The Rip Current Challenge | Steven Pfaff, Mark Willis and Victoria Oliva – National Weather Service Forecast Office Wilmington, North Carolina |
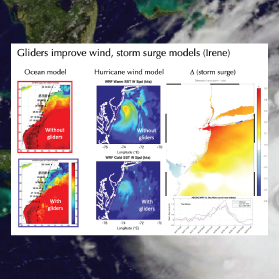
| April 28, 2020 | HurricaneGliders: Improving Typical Storm Intensity Forecasts with Real Time Data | Catherine Edwards, UGA SkIO Travis Miles, Rutgers University |
| March 24, 2020 | Where did my fish go? How scientists are working together to track fish over vast ocean space | Joy Young, Ph.D., The FACT Network |
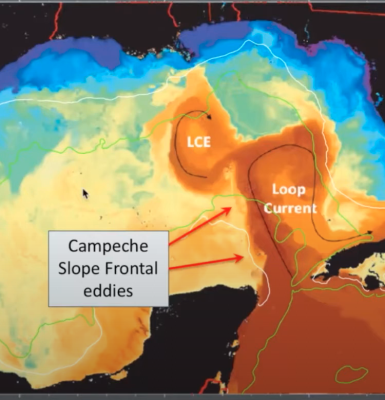
| December 10, 2019 | What do we know about the Loop Current in the Gulf of Mexico from recent observations? | Dr. Peter Hamilton, North Carolina State University |
| October 1, 2019 | Announcing OceanReports: A web based tool to inform planning and permitting in coastal and ocean waters | Dr. James Morris, Jr.; NOAA’s National Ocean Service, National Centers for Coastal Ocean Science |
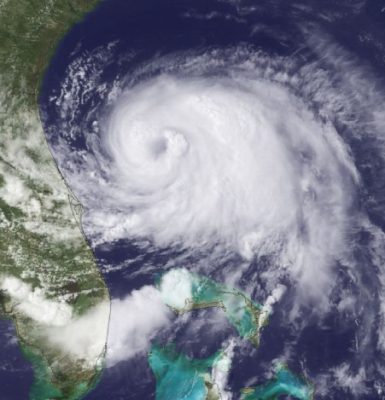
| May 28, 2019 | An Overview of Hurricane Florence | Steven Pfaff and Reid Hawkins, NOAA National Weather Service Wilmington NC |
| April 23, 2019 | Monitoring Harmful Algal Blooms with the Power of Citizen Scientist: The NOAA Phytoplankton Monitoring Network | Steve Morton, NOAA National Centers for Coastal Ocean Science |
| February 26, 2019 | Smart Sea Level Sensors for Emergency Planning and Response | Kim M. Cobb, Professor, Earth and Atmospheric Sciences, Georgia Tech Russell Clark, Research Faculty, Computer Science, Georgia Tech Nick Deffley, Director, Office of Sustainability, City of Savannah Emanuele Di Lorenzo, Professor, Earth and Atmospheric Sciences, Georgia Tech Jayma Koval, Research Faculty, CEISMC, Georgia Tech |
| September 25, 2018 | Observations to Understand Life in the Ocean: Linking IOOS Regional Efforts with the Marine Biodiversity Observation Network (MBON) | Frank E. Muller-Karger, University of South Florida College of Marine Science |
| August 28, 2018 | Resolving the Loop Current Complex: Implications on Hurricane Intensity Forecasting | Lynn Keith (Nick) Shay, PhD – University of Miami’s Rosenstiel School of Marine and Atmospheric Science |
| July 24, 2018 | The Power of Observations for improved decision making in support of public health and economic vitality: Gathering Alligators, Taking Observations, Realizing Solutions | Dwayne Porter, PhD University of South Carolina |
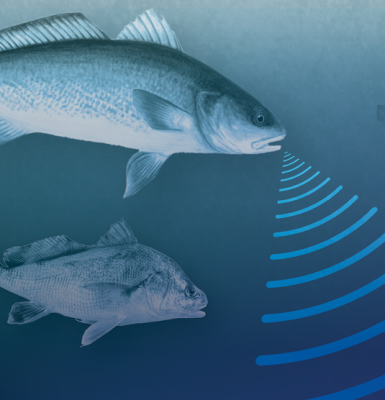
| April 24, 2018 | Passive acoustic monitoring on a SV3 Wave Glider for fish spawning aggregation detection and characterization | Laurent Cherubin, FAU’s Harbor Branch Oceanographic Institute |
| February 13, 2018 | West Florida Shelf and Tampa Bay Responses to Hurricane Irma: What Happened and Why | Dr. Robert Weisberg, University of South Florida College of Marine Science |
| December 19, 2017 | Recording Water Levels Through Citizen Science Reporting | Christine Buckel, National Oceanic and Atmospheric Administration’s National Centers for Coastal Ocean Science |
| November 28, 2017 | Web Camera Applications Testbed (WebCAT) Project Webinar | Debra Hernandez (SECOORA) Mark Willis (Surfline) Joseph Long (USGS) Greg Dusek (NOAA CO-OPS) Dwayne Porter (USC) |
| October 24, 2017 | SECOORA Marine Weather Portal | Jennifer Dorton (SECOORA) Charlton Galvarino (Second Creek Consulting, LLC) |
| October 3, 2017 | A year and A Hurricane Apart: Nutrient Loading in the St. Lucie Estuary in the Summers of 2016 and 2017 | Dr. Ian Walsh, Director of Science and Senior Oceanographer, Sea-Bird Scientific |
| September 6, 2017 | Predicting Marine Physical-Biogeochemical Variability in the Gulf of Mexico and Southeastern U.S. Shelf Seas | Dr. Ruoying He, Distinguished Professor of North Carolina State University |
| March 21, 2017 | SECOORA Data Portal | Kyle Wilcox, Axiom Data Science |
| January 31, 2024 | Improving Coastal Flood and Navigation Forecasting Through Model Coupling | Joseph Zhang, Virginia Institute of Marine Science |
| February 22, 2024 | Developing low-cost and open-source technologies for smart coastal communities | Phil Bresnahan, University of North Carolina Wilmington |
| June 28, 2022 | Long term Lake Okeechobee harmful algal bloom and water quality monitoring with the Nav2 Sail and Solar ASV | Scott Duncan Navocean and Veronica Ruiz Xomchuk Florida Atlantic University |
| March 27, 2024 | NOAA Resources to Help Coastal Communities Understand Flood Risk | Doug Marcy, NOAA Office for Coastal Management |
| April 11, 2024 | GCOOS - SECOORA Webinar Series Kickoff: OA Community and MBON Overview: State of the Science | Ana Palacio, NOAA Atlantic Oceanographic and Meteorological Laboratory Gabrielle Canonico, NOAA IOOS |
| April 30, 2024 | GCOOS - SECOORA Webinar Series: Monitoring Ocean Animals Using a Variety of Techniques | Luke Thompson, NOAA Atlantic Oceanographic and Meteorological Laboratory Neil Hammerschlag, Atlantic Shark Expeditions and Shark Research Foundation Jennifer Miksis-Olds, University of New Hampshire |
| May 30, 2024 | GCOOS - SECOORA Webinar Series: Flower Garden Banks National Marine Sanctuary - Identifying areas of data gaps, data needs and collaborations | Marissa Nuttall, Flower Garden Banks National Marine Sanctuary Xingping Hu, Texas A&M University Corpus Christi |
| July 25, 2024 | GCOOS - SECOORA Webinar Series: Ecosystem Services and the Blue Economy | Nathan Furey, University of New Hampshire, Coastal New England MBON Jessie Turner, International Alliance to Combat Ocean Acidification |
| August 27, 2024 | Rapid Floodwater Mapping and Depth Analysis Using Optical UAV and SAR Technology | Leila Hashemi-Beni, North Carolina A&T University |
| August 22, 2024 | GCOOS - SECOORA Webinar Series: International GeoBON Efforts | Martin Hernandez Ayon, Universidad Autonoma de Baja California Frank Müller-Karger, University of South Florida |
| January 23, 2025 | Implementing Vulnerability into Historic Hurricane Normalizations | Kaylee Mooney, Florida Gulf Coast University, 2023 SECOORA Data Challenge Winner |
| February 20, 2025 | SECOORA Data Portal Demo | Axiom Data Science |
| April 24, 2025 | Rapid Intensification of Hurricane Ian: Warm Subsurface Water on the Wide Continental Shelf | Dr. Yonggang Liu, University of South Florida |
| June 24, 2025 | Collaborative Fisheries with a SMILE (Size Matters: Innovative Length Estimates) | Dr. Jennifer Loch, Reef Environmental Education Foundation (REEF) |
| August 12, 2025 | SECOORA Proposal Development Q&A Session | Debra Hernandez, SECOORA Jennifer Dorton, SECOORA |
| September 24, 2025 | SOCAN Webinar: Coastal and Ocean Acidification Communication in Aquariums and Zoos | Katie St. Clair, Texas A&M University Kristen Ranges, Mote Marine Laboratory Jamie Lynn Lankenau, Jacksonville Zoo |
| October 21, 2025 | WebCOOS and Water Levels: Web Cameras for Coastal Flood Insights | Theo Jass, SECOORA WebCOOS Project Team |
| March 27, 2026 | SET Webinar Series: Partner Spotlight on the South Atlantic Salt Marsh Initiative | Dr. Michelle Covi, SERPPAS Amanda Gobeli, SASMI |
| May 6, 2026 | Preparing for Hurricane Season with SECOORA: Observing Systems, Data, and Tools | Debra Hernandez, SECOORA Greg Dusek, Dusek Coastal Science & Consulting Lynn Leonard, University of North Carolina Wilmington Catherine Edwards, UGA Skidaway Institute of Oceanography |

WebCOOS and Water Levels: Web Cameras for Coastal Flood Insights
Presenter:
Theo Jass, SECOORA
WebCOOS Project Team
Recorded: October 21, 2025
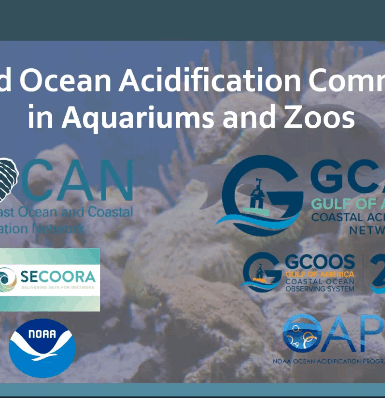
SOCAN Webinar: Coastal and Ocean Acidification Communication in Aquariums and Zoos
Presenter:
Katie St. Clair, Texas A&M University
Kristen Ranges, Mote Marine Laboratory
Jamie Lynn Lankenau, Jacksonville Zoo
Recorded: September 24, 2025

SECOORA Proposal Development Q&A Session
Presenter:
Debra Hernandez, SECOORA
Jennifer Dorton, SECOORA
Recorded: August 12, 2025
SECOORA is soliciting Letters of Intent (LOIs) to be reviewed and considered for inclusion in SECOORA’s full proposal submission to NOAA. These LOIs are due to SECOORA by 11:59 PM ET September 9, 2025. Any submissions that do not comply with the Letter of Intent requirements will be rejected and not considered for inclusion in the SECOORA IOOS proposal.
Collaborative Fisheries with a SMILE (Size Matters: Innovative Length Estimates)
Presenter:
Dr. Jennifer Loch, Reef Environmental Education Foundation (REEF)
Recorded: June 24, 2025

Rapid Intensification of Hurricane Ian: Warm Subsurface Water on the Wide Continental Shelf
Presenter:
Dr. Yonggang Liu, University of South Florida
Recorded: April 24, 2025
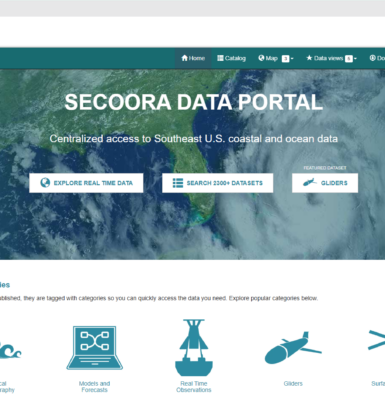
SECOORA Data Portal Demo
Presenter:
Axiom Data Science
Recorded: February 20, 2025
Implementing Vulnerability into Historic Hurricane Normalizations
Presenter:
Kaylee Mooney, Florida Gulf Coast University, 2023 SECOORA Data Challenge Winner
Recorded: January 23, 2025
Rapid Floodwater Mapping and Depth Analysis Using Optical UAV and SAR Technology
Presenter:
Leila Hashemi-Beni, North Carolina A&T University
Recorded: August 27, 2024
GCOOS - SECOORA Webinar Series: Ecosystem Services and the Blue Economy
Presenter:
Nathan Furey, University of New Hampshire, Coastal New England MBON
Jessie Turner, International Alliance to Combat Ocean Acidification
Recorded: July 25, 2024
GCOOS - SECOORA Webinar Series: Flower Garden Banks National Marine Sanctuary - Identifying areas of data gaps, data needs and collaborations
Presenter:
Marissa Nuttall, Flower Garden Banks National Marine Sanctuary
Xingping Hu, Texas A&M University Corpus Christi
Recorded: May 30, 2024
GCOOS - SECOORA Webinar Series: Monitoring Ocean Animals Using a Variety of Techniques
Presenter:
Luke Thompson, NOAA Atlantic Oceanographic and Meteorological Laboratory
Neil Hammerschlag, Atlantic Shark Expeditions and Shark Research Foundation
Jennifer Miksis-Olds, University of New Hampshire
Recorded: April 30, 2024
GCOOS - SECOORA Webinar Series Kickoff: OA Community and MBON Overview: State of the Science
Presenter:
Ana Palacio, NOAA Atlantic Oceanographic and Meteorological Laboratory
Gabrielle Canonico, NOAA IOOS
Recorded: April 11, 2024
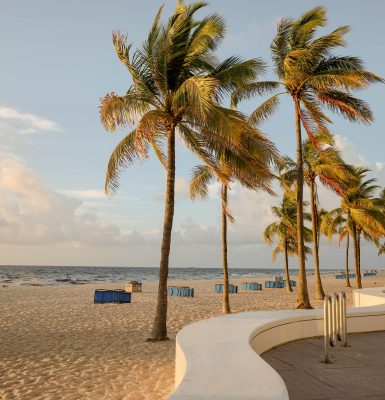
NOAA Resources to Help Coastal Communities Understand Flood Risk
Presenter:
Doug Marcy, NOAA Office for Coastal Management
Recorded: March 27, 2024
Developing low-cost and open-source technologies for smart coastal communities
Presenter:
Phil Bresnahan, University of North Carolina Wilmington
Recorded: February 22, 2024
Improving Coastal Flood and Navigation Forecasting Through Model Coupling
Presenter:
Joseph Zhang, Virginia Institute of Marine Science
Recorded: January 31, 2024
Mote Marine Laboratory’s Beach Conditions Reporting System
Presenter:
Aspen Cook, Mote Marine Laboratory
Recorded: April 4, 2023
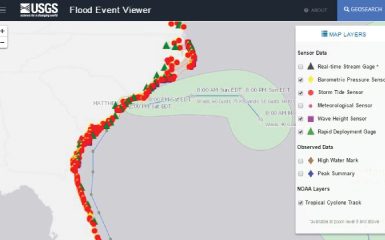
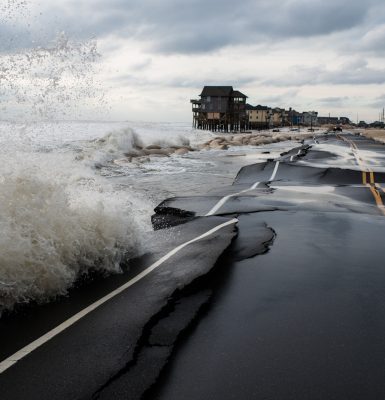
USGS Water Observing Systems Network & Response to 2022 Tropical & Extratropical Storms
Presenter:
Athena Clark and Brian McCallum, United States Geological Survey (USGS)
Recorded: March 7, 2023
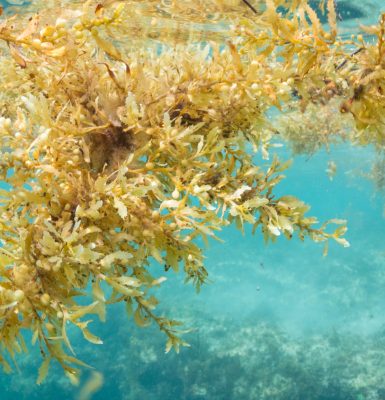
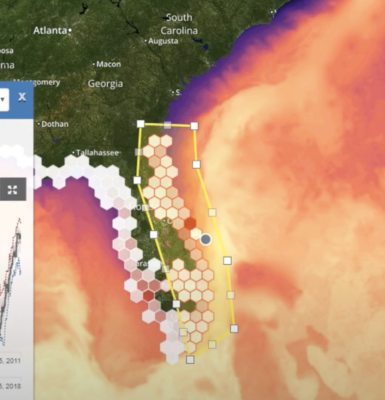
Sargassum Watch from Space
Presenter:
Dr. Chuanmin Hu, College of Marine Science, University of South Florida
Recorded: October 25, 2022
Georgia Virtual Data Workshop: Discovering and Accessing Coastal and Ocean Data
Presenter:
SECOORA, Axiom Data Science, and Sapelo Island National Estuarine Research Reserve, NOAA National Estuarine Research Reserves System
Recorded: October 5, 2022
ShellBase: Water Quality Data from Shellfish Harvest Waters in One Database
Presenter:
Natalie Nelson, North Carolina State University
Megan Carr, North Carolina State University
Natalie "Nat" Chazal, North Carolina State University
Recorded: September 27, 2022
Lake Okeechobee harmful algal bloom & water quality monitoring with Nav2 Sail & Solar ASV
Presenter:
Scott Duncan, Navocean Inc
Veronica Ruiz Xomchuk, Harbor Branch Oceanographic Institute
Recorded: June 28, 2022
A High resolution Ocean Reanalysis of the Northwest Atlantic in Support of Climate Change Studies
Presenter:
Dr. Ruoying He, North Carolina State University
Recorded: June 21, 2022
Predicting High Cross Currents Near South Florida Ports Using Machine Learning
Presenter:
Dr. Steven D. Meyers, University of South Florida College of Marine Science
Mark E. Luther, University of South Florida College of Marine Science
Recorded: January 25, 2022
It’s hot! How temperature is impacting Spotted Seatrout and seagrass in Florida Bay
Presenter:
Jonathan Rodemann, Florida International University Ph.D. Candidate
Recorded: October 26, 2021
Applying Technology to Improve our Ability to Forecast, Observe and Detect Rip Currents
Presenter:
Grek Dusek, NOAA, National Ocean Service
Alex Pang, University of California Santa Cruz
Recorded: June 22, 2021
4th Grade Curriculum: Water Shapes Our Planet and Our Lives
Presenter:
Katy Smith, Jill Gambill, and Nina Sassano (University of Georgia Marine Extension and Georgia Sea Grant)
Recorded: April 27, 2021
Making the Data Work for You
Presenter:
Lauren Showalter and Brian Stone, Axiom Data Science
Recorded: March 23, 2021
• search and download real-time and historical data • compare datasets from different stations
• generate and share custom data views
• access metadata for SECOORA stations
• access regional and sub-regional models (including coastal circulation, water quality and fisheries habitat models)
This webinar will highlight key features of the SECOORA Data Portal and the new Text-a-Buoy program. Axiom Data Science will showcase new Data Portal capabilities including:
• faster display of dense profiling data sets
• improved information on sensor and station pages faster chart loading
• ERDDAP data downloads which automatically incorporate time/depth dimensions
• ability to select time periods on charts.
Learn how the SECOORA data system is using data to meet the needs of users and how to make the data work for you.
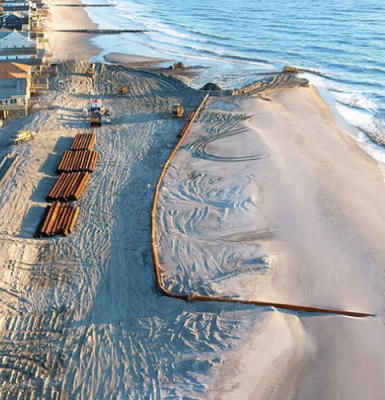
Regional Ocean Data Sharing Southeast Sand Resources Project
Presenter:
Mary Conley, The Nature Conservancy
Recorded: February 23, 2021
The Trouble with Deep Learning
Presenter:
Paul Gader, University of Florida
Recorded: January 26, 2021
Developing an Integrated Coastal Water Predictive Capability to Promote Resilience
Presenter:
Ruoying He, North Carolina State University
Jennifer Dorton, SECOORA
Charlton Galvarino, Second Creek Consulting
Recorded: December 15, 2020
What’s all that racket! Estuarine soundscapes in South Carolina
Presenter:
Eric W. Montie, M.S., Ph.D., University of South Carolina Beaufort
Recorded: November 17, 2020
Observations on the West Florida Shelf Pressure Point
Presenter:
Dr. Bob Weisberg, University of South Florida College of Marine Science
Recorded: August 25, 2020
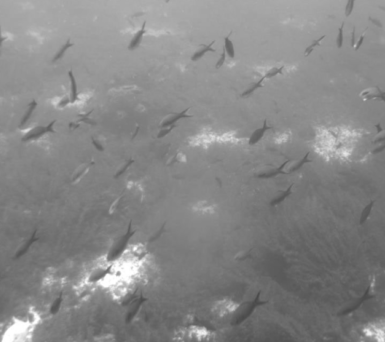
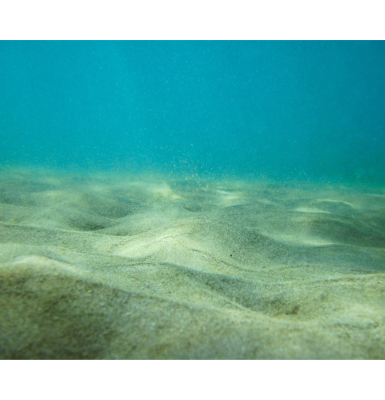
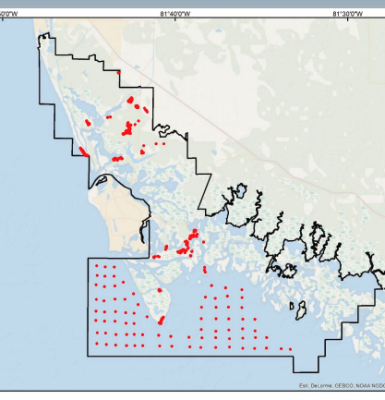
Establishing Baselines for Benthic Habitat and Fish Populations on the West Florida Shelf
Presenter:
Dr. Steven Murawski, Chad Lembke, Sarah Grasty, and Alex Ilich – University of South College of Marine Science
Recorded: July 28, 2020
Coastal 3-D high-resolution maps for floods, wetlands, and biodiversity
Presenter:
Dr. Matt McCarthy, Oak Ridge National Laboratory
Recorded: June 23, 2020
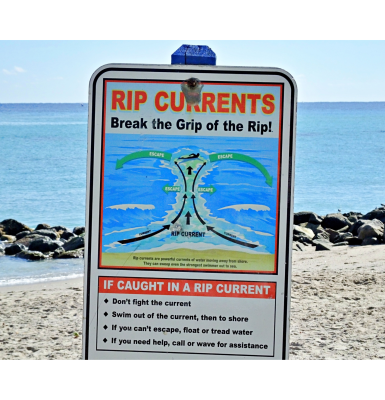
The Rip Current Challenge
Presenter:
Steven Pfaff, Mark Willis and Victoria Oliva – National Weather Service Forecast Office Wilmington, North Carolina
Recorded: May 26, 2020
HurricaneGliders: Improving Typical Storm Intensity Forecasts with Real Time Data
Presenter:
Catherine Edwards, UGA SkIO
Travis Miles, Rutgers University
Recorded: April 28, 2020
Where did my fish go? How scientists are working together to track fish over vast ocean space
Presenter:
Joy Young, Ph.D., The FACT Network
Recorded: March 24, 2020
What do we know about the Loop Current in the Gulf of Mexico from recent observations?
Presenter:
Dr. Peter Hamilton, North Carolina State University
Recorded: December 10, 2019
Announcing OceanReports: A web based tool to inform planning and permitting in coastal and ocean waters
Presenter:
Dr. James Morris, Jr.; NOAA’s National Ocean Service, National Centers for Coastal Ocean Science
Recorded: October 1, 2019
An Overview of Hurricane Florence
Presenter:
Steven Pfaff and Reid Hawkins, NOAA National Weather Service Wilmington NC
Recorded: May 28, 2019
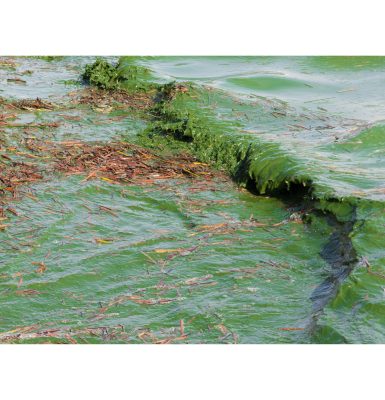
Monitoring Harmful Algal Blooms with the Power of Citizen Scientist: The NOAA Phytoplankton Monitoring Network
Presenter:
Steve Morton, NOAA National Centers for Coastal Ocean Science
Recorded: April 23, 2019
NOAA’s Phytoplankton Monitoring Network is a citizen science volunteer based program in which volunteers are trained to look for the presence of organisms that could potentially cause a harmful algal bloom.
This presentation will touch on methods used for training new volunteers, including smartphone applications, storyboards, digital microscopes, and advanced flow cytometry as well as how volunteer generated data are used by scientists to develop and refine new models of prediction for HABs and climate change.
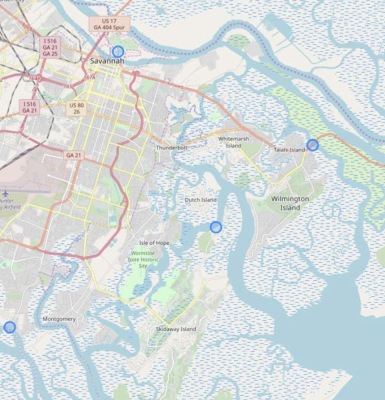
Smart Sea Level Sensors for Emergency Planning and Response
Presenter:
Kim M. Cobb, Professor, Earth and Atmospheric Sciences, Georgia Tech
Russell Clark, Research Faculty, Computer Science, Georgia Tech
Nick Deffley, Director, Office of Sustainability, City of Savannah
Emanuele Di Lorenzo, Professor, Earth and Atmospheric Sciences, Georgia Tech
Jayma Koval, Research Faculty, CEISMC, Georgia Tech
Recorded: February 26, 2019
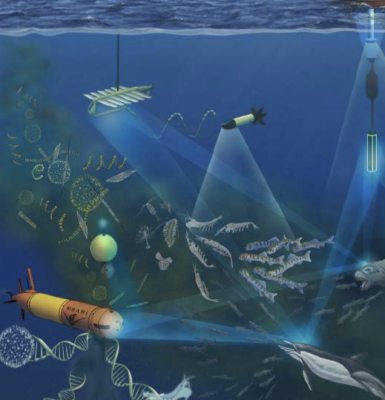
Observations to Understand Life in the Ocean: Linking IOOS Regional Efforts with the Marine Biodiversity Observation Network (MBON)
Presenter:
Frank E. Muller-Karger, University of South Florida College of Marine Science
Recorded: September 25, 2018
In the region covered by the Southeast Coastal Ocean Observing Regional Association (SECOORA), MBON works in partnership with the Florida Keys National Marine Sanctuary and the Integrated Ocean Observing System to integrate traditional and new means of tracing changes in marine biodiversity. We developed novel environmental DNA methods and are developing indicators to evaluate changes in living communities. Dynamic ‘seascapes’ based on remote sensing extend the spatial footprint of in situ data to track dynamic biogeographic regions. We promote adoption of the Darwin Core data schema as a way to standardize archiving and distribution of marine biology data. This is essential if we want to understand patterns of change in marine life in any locality in the context of changes happening over large areas, and broadly share applications to do so.
Internationally, MBON works with the Global Ocean Observing System (GOOS), the Ocean Biogeographic Information System (OBIS), the IOC Ocean Best Practices Group, and others to promote documentation of marine biodiversity for the benefit of society. The goal is to integrate marine biological Essential Biodiversity Variables (EBVs) and Essential Ocean Variables (EOVs) into the existing and planned national and international ocean observing systems. We invite the IOOS community to join in the dialogue with stakeholders and MBON to refine these ideas and advance an integrated system to observe life in the sea.
Resolving the Loop Current Complex: Implications on Hurricane Intensity Forecasting
Presenter:
Lynn Keith (Nick) Shay, PhD – University of Miami’s Rosenstiel School of Marine and Atmospheric Science
Recorded: August 28, 2018
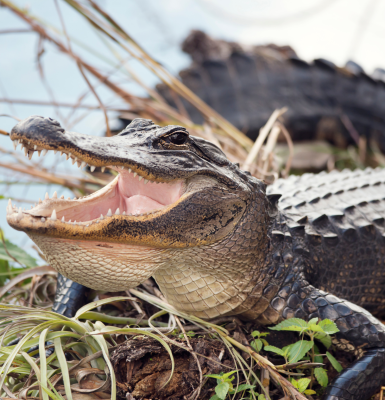
The Power of Observations for improved decision making in support of public health and economic vitality: Gathering Alligators, Taking Observations, Realizing Solutions
Presenter:
Dwayne Porter, PhD University of South Carolina
Recorded: July 24, 2018
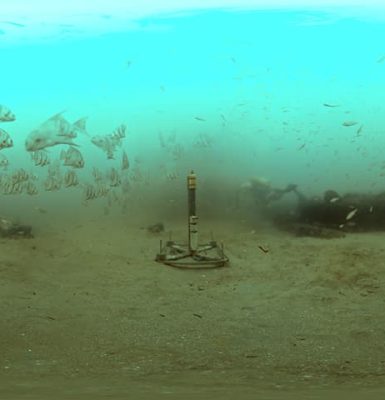
Passive acoustic monitoring on a SV3 Wave Glider for fish spawning aggregation detection and characterization
Presenter:
Laurent Cherubin, FAU’s Harbor Branch Oceanographic Institute
Recorded: April 24, 2018
April 24, 2018
Many commercially important reef fishes in the Caribbean and southeast US have been overfished to the point that some species, like the Nassau grouper, is considered threatened and on the endangered species list. Mature adults of some species gather in large numbers every year for two to three months at specific locations to spawn.
Once located, the spawning aggregations become an easy target that can be reduced until it can no longer be formed. Most grouper and snapper spawning aggregations in the region have been extirpated and the few that have been documented are vulnerable unless protection can be enacted.
We have developed and demonstrated a novel, autonomous approach to conduct fishery independent surveys in order to search and discover unreported aggregations by mapping the underwater acoustic landscape using an unmanned platform in areas that surround currently known spawning aggregations during the spawning season.
While passive acoustic methods have previously been used for fisheries management and stock assessment, the platforms and algorithms are not currently mature enough to allow for advanced autonomy, drastically limiting the spatial and temporal range, and resulting in considerable operational costs.
In addition to discovering previously unknown spawning sites, the development of novel algorithms, and passive acoustic and environmental sensor systems enables monitoring along with automated detection, classification and surveillance of fish vocalizations.
As well as providing significantly finer scale detection with low latency, this innovative approach also enables greater on-board intelligence and autonomy; reduced launch/recovery and satellite data cost thus further reducing the overall operational costs, while enhancing performance for ocean monitoring missions.
Next Generation SECOORA Data Portal
Presenter:
Stacey Buckelew and Brian Stone, Axiom Data Science
Recorded: February 27, 2018
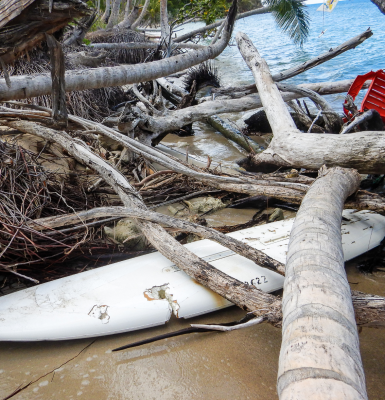
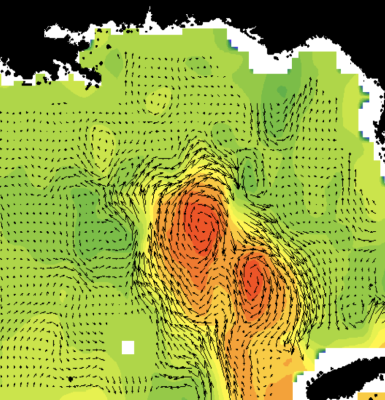
West Florida Shelf and Tampa Bay Responses to Hurricane Irma: What Happened and Why
Presenter:
Dr. Robert Weisberg, University of South Florida College of Marine Science
Recorded: February 13, 2018
Both the observations and the model simulations revealed strong upwelling and vertical mixing followed by a downwelling as the storm passed by. This was accompanied by a rapid drop in sea surface temperature by about 4 degrees C and large decreases in sea level with negative surges causing drying in the Florida Bay, Charlotte Harbor, Tampa Bay estuaries and the Big Bend region. The transport and exchange of water between the shelf and the estuaries and between the shelf and the Florida Keys reef track during the hurricane have important ecosystem and sediment transport implications, including an inlet breach that occurred at the Pinellas Co. Shell Key preserve.
Recording Water Levels Through Citizen Science Reporting
Presenter:
Christine Buckel, National Oceanic and Atmospheric Administration’s National Centers for Coastal Ocean Science
Recorded: December 19, 2017
Various state and federal partners are currently using water level reports and photographs as communication and model validation tools. Explore the web-based application: What’s your water level? Or log a report from your mobile device.