SECOORA’s 2020 Data Challenge Winner, Douglas Cahl from the University of South Carolina, has developed a new online tool that identifies eddies from 6km resolution High Frequency radar (HF radar) current data.
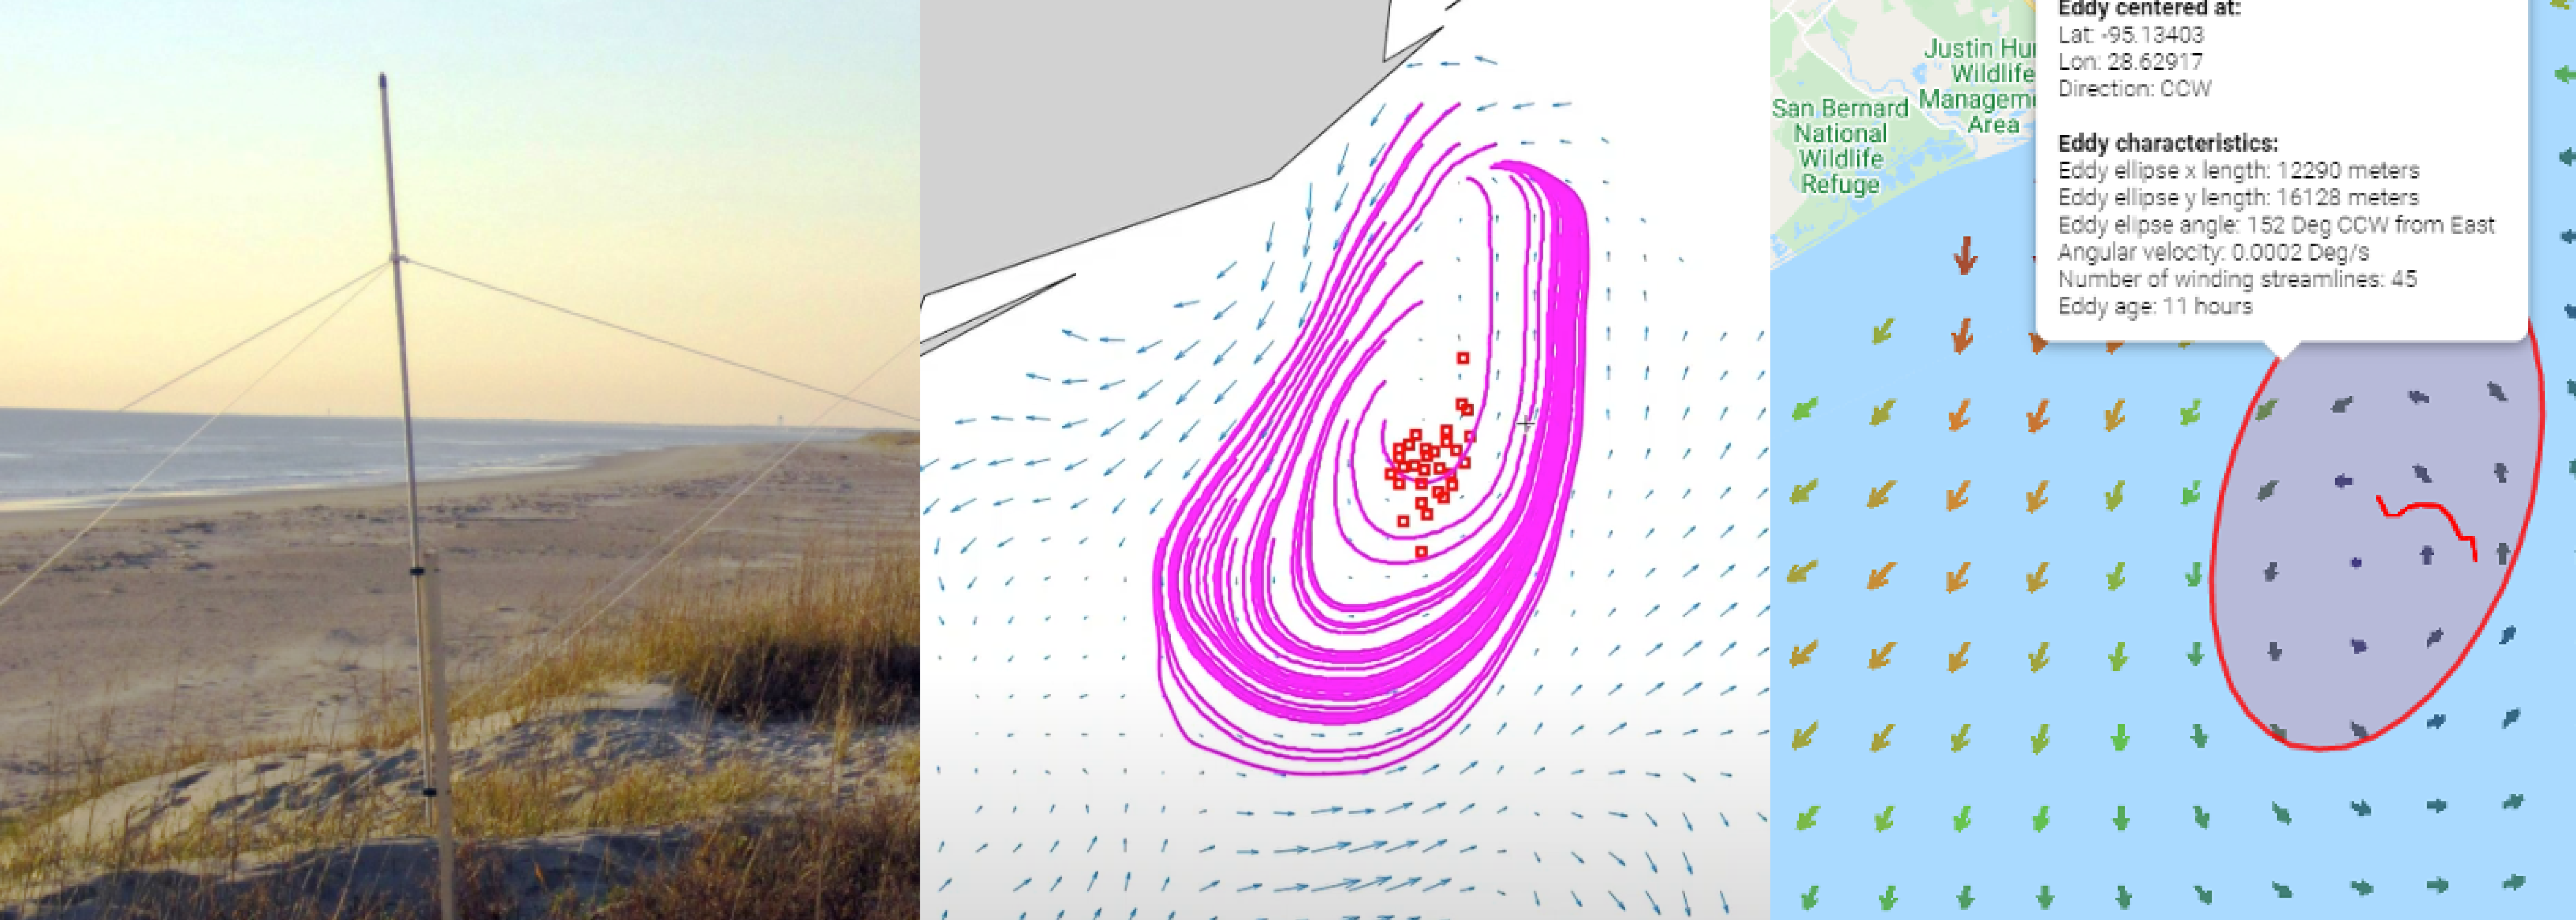
HF radars are land-based systems that measure the speed and direction of ocean surface currents in near real-time. Interesting features are often seen in the ocean’s surface currents, such as eddies.
Eddies are loops of swirling water. In the Southeast, small and large eddies often break off from the Gulf Stream. Eddies are important ocean features – affecting pollution and larvae transport, fishing, mixing in the ocean, primary production, and even can be a danger to oil rig operations.
This new tool leverages HF radar’s unique data set to identify where eddies are located. Whether looking for the best fishing spot or researching ocean currents, this tool makes it so you do not have to be an expert to locate eddies.
Due to the need for real time analysis, this software created by Cahl is currently being run hourly. Every hour, tidally removed 25 hour averaged HF radar surface currents are analyzed by the software to identify eddies.
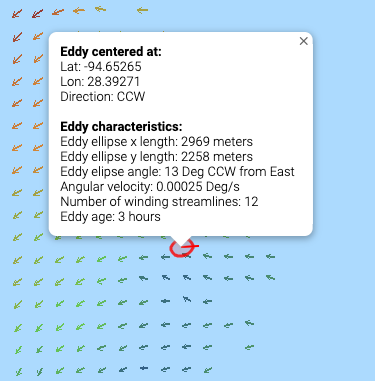
They are displayed on this website and the red dots highlight the eddy feature (if you zoom in you will see it is an ellipse signifying the shape of the eddy). Clicking on them will tell more about eddy identification (see picture on right).
The video below details how eddies are spotted using HF radar data.
This open source software is available for download and modification (GNU license) for scientific purposes and is easy enough to manipulate for the average python user. A description of the data set is provided on the website. This data set includes detailed information on eddies identified in the HF radar data sets since Feb 28, 2021.
Real time data analysis is also provided in a downloadable ‘csv’ file for ease of use (you can open it in excel).The ‘csv’ file is targeted at science and nonscience users not comfortable with python data manipulation. The website tool can be used by anyone interested in these ocean features, and is a great way to explore the HF radar measurements.
More information and source code can be found below:
- Eddy analysis using 6km HF radar currents available as an interactive map with near real-time data
- Full eddy analysis files for download, data description available here
- Download latest data set (6km hf radar currents) here
- Check out the code code for usage and file creation details.
Contact communications@secooraorgpact.wpengine.com if you have any questions.
Related news

Spotlight: Mobilizing to Save Florida’s Coral Reefs
Learn how scientists are racing to save Florida's Coral Reef through coral rescue, gene banking, reef restoration, and innovative conservation efforts after disease and marine heatwaves devastated one of America's most important marine ecosystems.

From a Whale’s Song to an Ocean’s Symphony: How AI Decodes Underwater Sound
Explore how SECOORA-funded research is using AI and machine learning to decode ocean soundscapes, detect boat noise, and support coral reef restoration efforts.

Rebuilding the Future: USF’s College of Marine Science Recovers from Historic Blaze One Day at a Time
Following a devastating fire at USF’s Marine Science Lab, researchers rally to salvage decades of critical data and maintain vital ocean monitoring.