SECOORA is excited to announce the launch of the Southeast Marine Mapping Tool developed by The Nature Conservancy. This new tool assists ocean planning and management decisions, like offshore wind energy siting, by providing access to data such as:
- Observation and density data for fish, marine mammal, and bird species
- Seafloor and water column features
- Ocean uses and fisheries management areas
Using Data for Ocean Planning
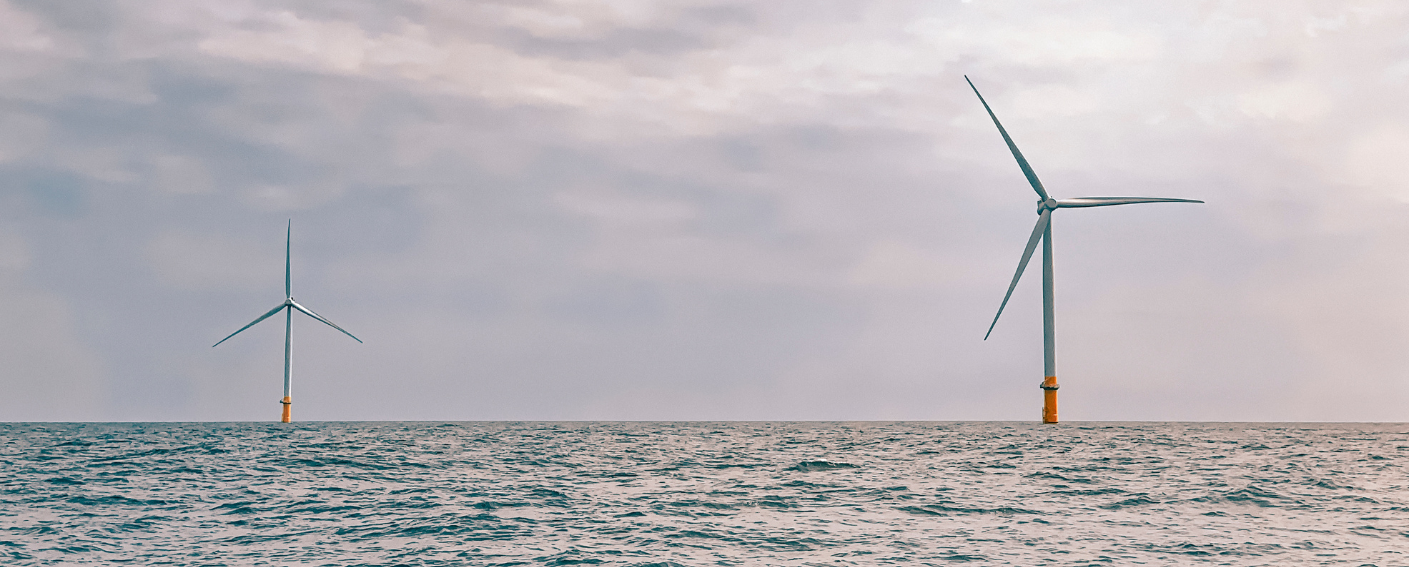
It is important for proposed offshore projects – such as wind energy sites or sand dredging – to assess the potential to impact marine species and habitats in the area. When evaluating new potential sites for offshore development, the Southeast Marine Mapping Tool provides access to datasets for better decisions.
“The Southeast Marine Mapping Tool increases access to crucial data needed for informed decisions on the siting of new and expanding ocean uses.”
Mary Conley, The Nature Conservancy
One anticipated use is review of Environmental Impact Statements (EIS) which are required for every offshore development project. Stakeholders often don’t have the time or capacity to compile and analyze all available data and information during the EIS review timeline. Ocean stakeholders can now easily view available information for any selected area of the map with a few simple clicks.
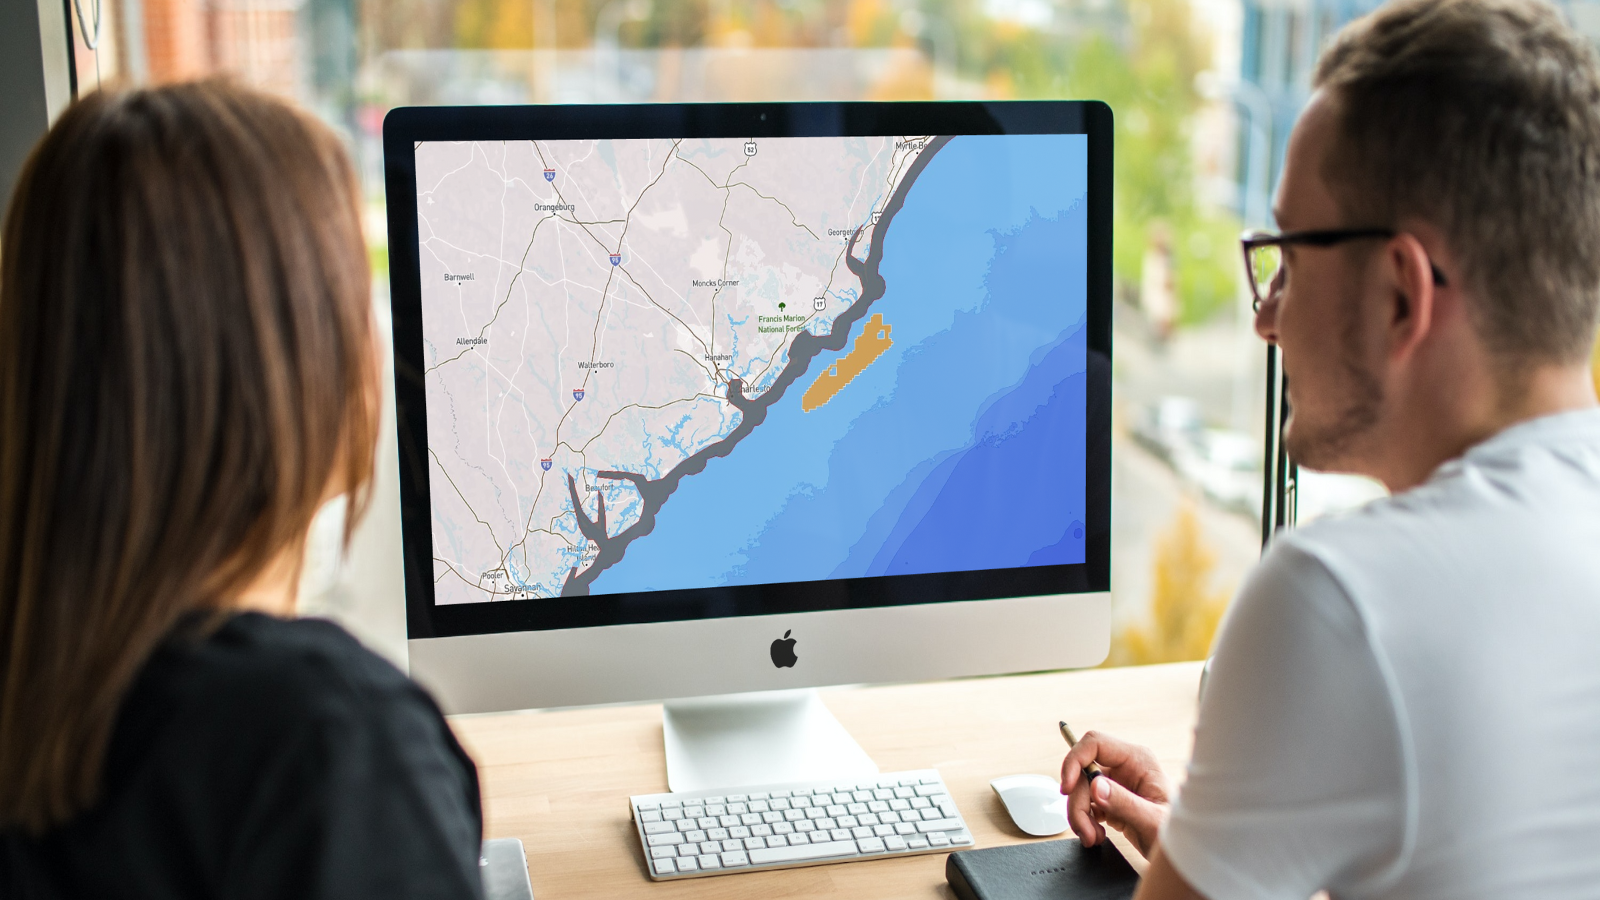
Navigating the Southeast Marine Mapping Tool
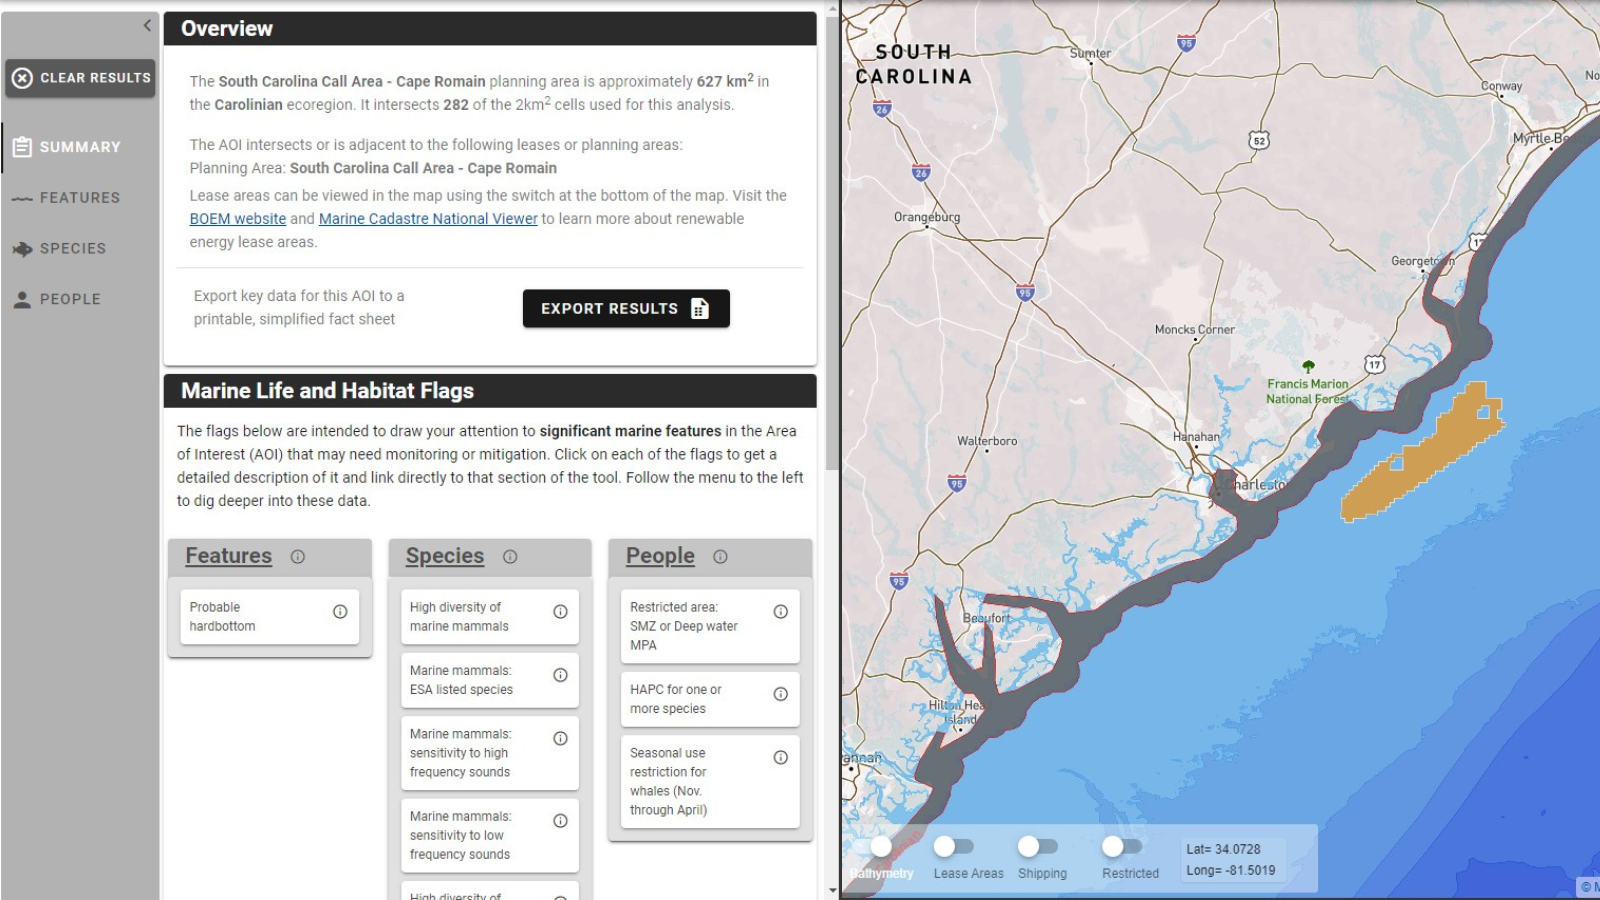
With the Southeast Marine Mapping Tool, decision-makers can draw, upload, or select existing areas for projects and view the data and information for their chosen sites. The data included can be broken up into three categories:
Feature Flags inform about seafloor or water column features such as depth, sediment composition, temperature, and salinity
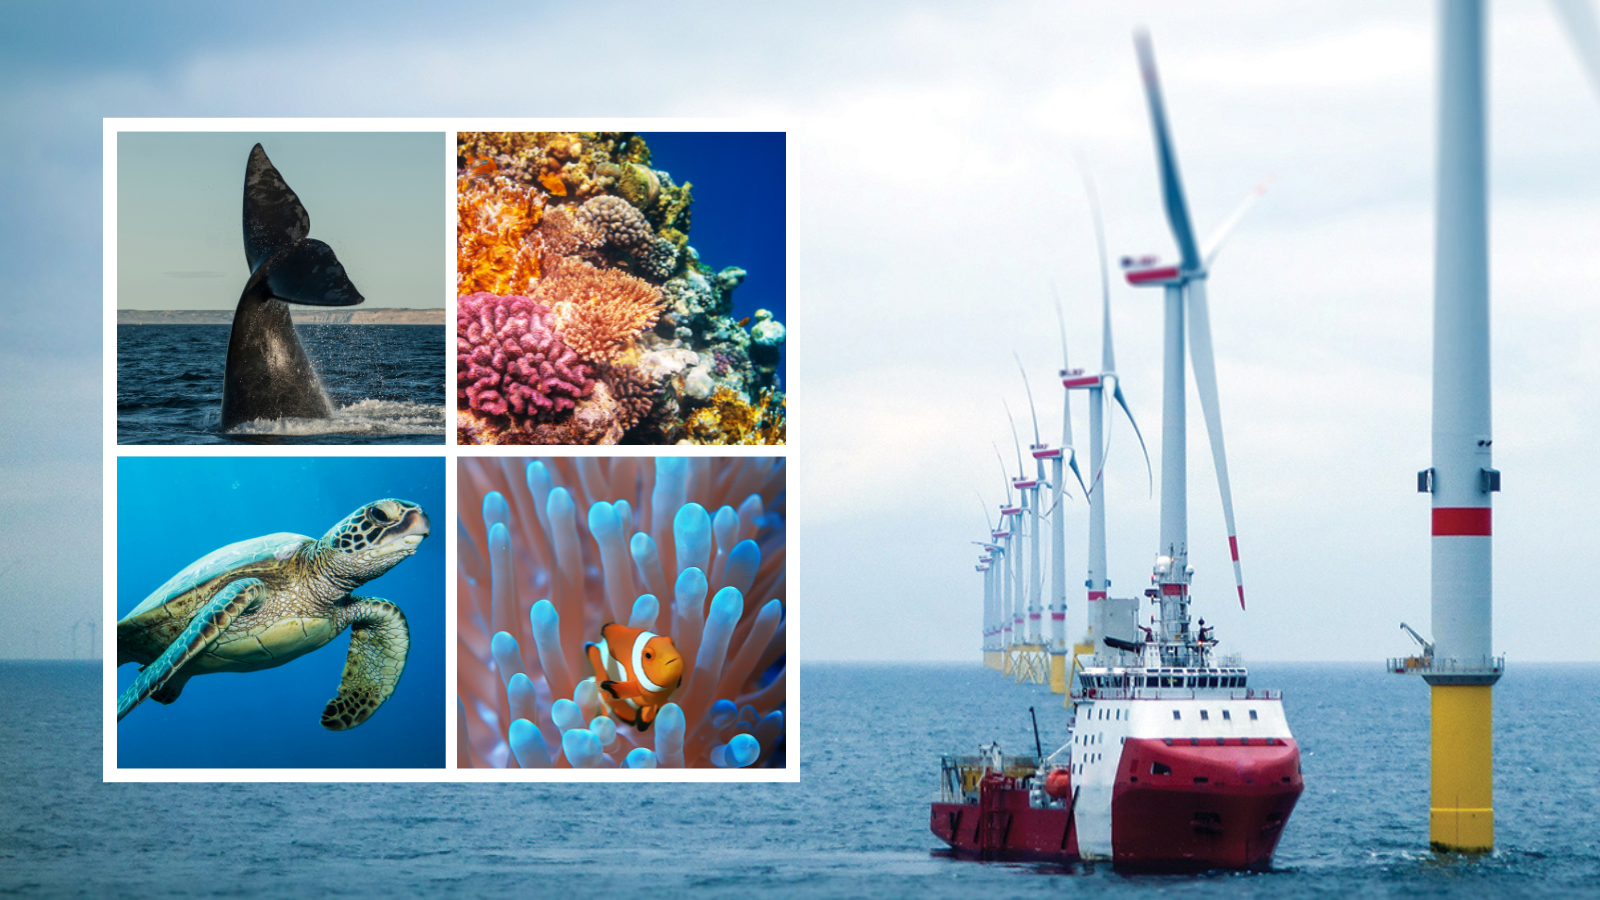
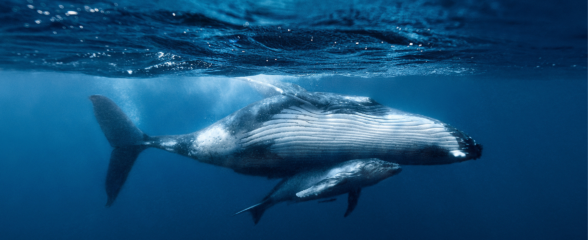
Species Flags inform about key species reported in the area, such as fish, corals, marine mammals, birds, and turtles

People Flags inform about designated fish habitats, artificial reefs, fishing restrictions, shipping traffic, and other human-related management considerations
Combining different types of data gives context for impacts to a potential development site. For example, the presence of a fish species within a site carries more weight when data also shows the presence of a coral reef or shipwreck. This gives context as to why the fish were there, and alludes to the possibility that the site is an important habitat. This level of interpretation allows users to more accurately compare potential impacts and consider the relationships between other places across the region.
Other Uses of the Southeast Marine Mapping Tool
The Southeast Marine Mapping Tool was created with decision-makers in mind, but it also can act as a platform for communication and education. Students can easily explore the ocean from their classrooms and learn about oceanographic features, uses, and regulations. Organizations that are interested in giving feedback to planners can access the same information that was used to choose the sites, providing a layer of transparency.
Future Steps
For the first stage of development, The Nature Conservancy’s team was able to gather and interpret available data to give context for potential impacts of offshore development in the Southeast. For phase two, they plan to meet with primary users to refine the Southeast Marine Mapping Tool to gather additional data and functionality needed to make it as useful as possible in the decision-making process.
Contact Mary Conley (mconley@tnc.org) to be included in the refinement process or provide feedback on the tool through the contact link on the website (crcs@tnc.org).
Related news
From a Whale’s Song to an Ocean’s Symphony: How AI Decodes Underwater Sound
Explore how SECOORA-funded research is using AI and machine learning to decode ocean soundscapes, detect boat noise, and support coral reef restoration efforts.
Rebuilding the Future: USF’s College of Marine Science Recovers from Historic Blaze One Day at a Time
Following a devastating fire at USF’s Marine Science Lab, researchers rally to salvage decades of critical data and maintain vital ocean monitoring.

Reimagining the Deep: BioTrack and the Whitespotted Eagle Rays of Florida’s Indian River Lagoon
Join FAU researchers as they track endangered whitespotted eagle rays in Florida’s Indian River Lagoon using advanced BioTrack acoustic and video tags.